Estimated Value: $573,000 - $821,000
About This Home
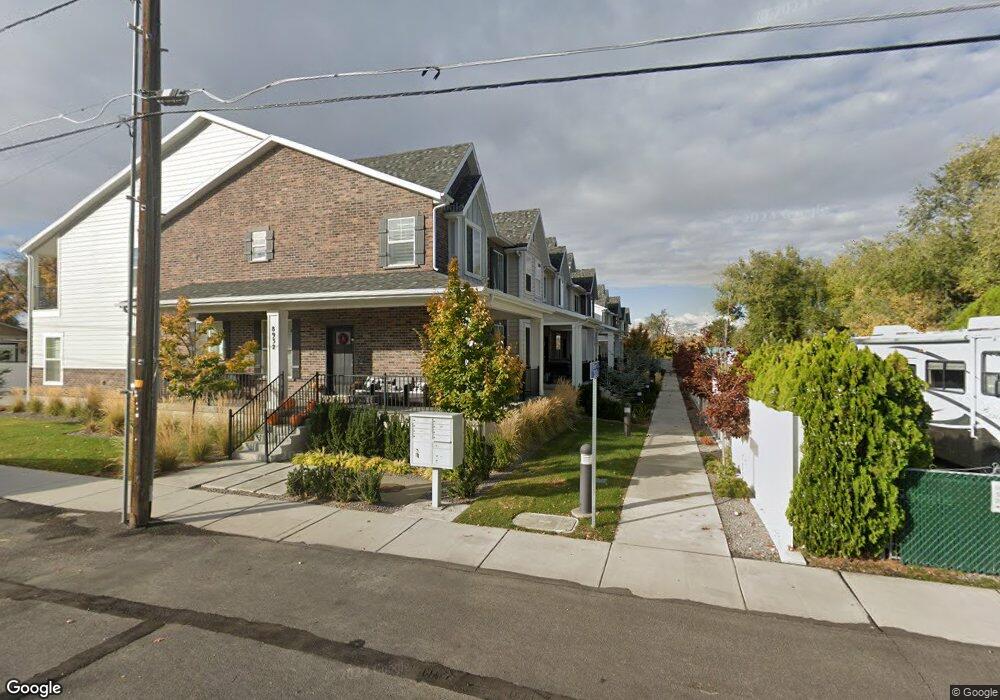
This home is located at 206 E Diver Ct, Sandy, UT 84070 and is currently estimated at $674,629, approximately $326 per square foot. 206 E Diver Ct is a home with nearby schools including Sandy Elementary School, Mount Jordan Middle School, and Jordan High.
Ownership History
We collect this data history from publicly available records. To have your information removed, we recommend requesting removal directly through your county’s website.
Purchase Details
Purchase Details
Home Financials for this Owner
Home Financials are based on the most recent Mortgage that was taken out on this home.Purchase Details
Home Financials for this Owner
Home Financials are based on the most recent Mortgage that was taken out on this home.Home Values in the Area
Average Home Value in this Area
Purchase History
We collect this data history from publicly available records. To have your information removed, we recommend requesting removal directly through your county’s website.
| Date | Buyer | Sale Price | Title Company |
|---|---|---|---|
| -- | Northern Title Company | ||
| -- | Northern Title Co | ||
| -- | Northern Title Co |
Mortgage History
We collect this data history from publicly available records. To have your information removed, we recommend requesting removal directly through your county’s website.
| Date | Status | Borrower | Loan Amount |
|---|---|---|---|
| Previous Owner | $300,000 |
Tax History
We collect this data history from publicly available records. To have your information removed, we recommend requesting removal directly through your county’s website.
| Year | Tax Paid | Tax Assessment Tax Assessment Total Assessment is a certain percentage of the fair market value that is determined by local assessors to be the total taxable value of land and additions on the property. | Land | Improvement |
|---|---|---|---|---|
| 2025 | $3,560 | $669,400 | $55,100 | $614,300 |
| 2024 | $3,263 | $603,500 | $50,600 | $552,900 |
| 2023 | $2,932 | $540,600 | $48,100 | $492,500 |
| 2022 | $3,127 | $563,300 | $47,200 | $516,100 |
| 2021 | $3,035 | $465,400 | $36,900 | $428,500 |
| 2020 | $464 | $36,900 | $36,900 | $0 |
Map
- 265 E 8880 S Unit 12
- 9096 S 260 E
- 8780 S 250 E
- 240 E 9125 S
- 8831 S 400 E
- 413 E 9120 S
- 362 E 9150 S
- 412 E 8760 S
- 9203 S 220 E
- 8947 S 500 E
- 541 Mingo View Ave
- 448 E 9150 S
- 59 E 8680 S
- 9135 S 510 E
- Lot 2 Cottage Rd
- 41 W Crawford Place
- 8732 S 620 E
- 17 Tiny Wood Dr
- 8522 S Solar Way Unit 8522
- 65 Pioneer Ave
Ask me questions while you tour the home.