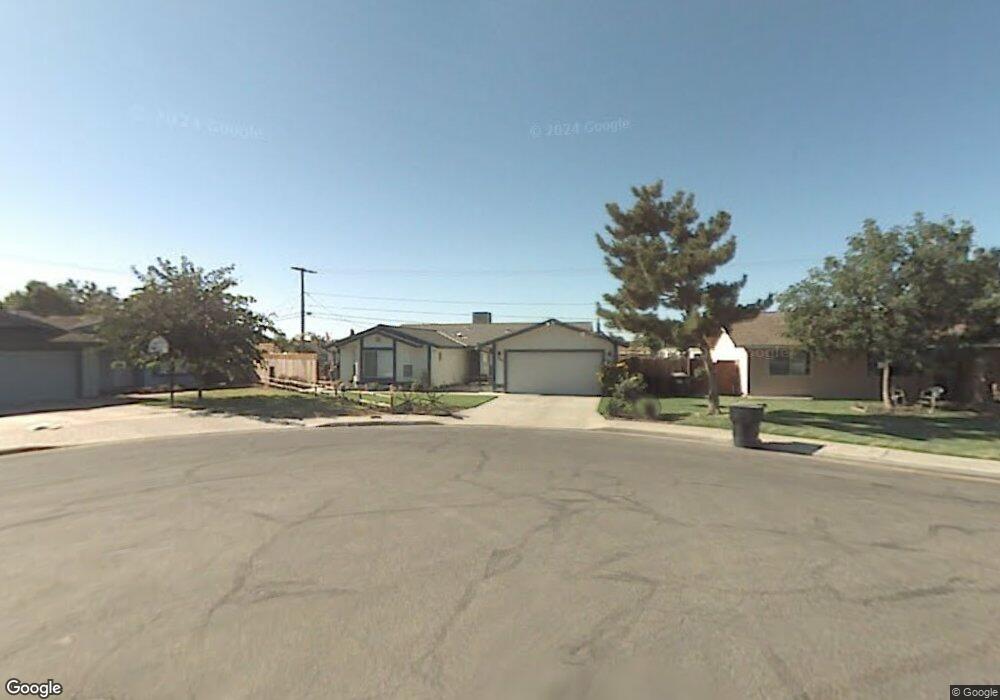
891 Clover Ln Hanford, CA 93230
Estimated Value: $337,000 - $367,847
3
Beds
2
Baths
1,659
Sq Ft
$213/Sq Ft
Est. Value
About This Home
This home is located at 891 Clover Ln, Hanford, CA 93230 and is currently estimated at $353,462, approximately $213 per square foot. 891 Clover Ln is a home located in Kings County with nearby schools including George Washington Elementary School, John F. Kennedy Junior High School, and Hanford High School.
Ownership History
Date
Name
Owned For
Owner Type
Purchase Details
Closed on
Jun 5, 2005
Sold by
Glory George W
Bought by
Glory George W
Current Estimated Value
Home Financials for this Owner
Home Financials are based on the most recent Mortgage that was taken out on this home.
Original Mortgage
$50,000
Interest Rate
5.74%
Mortgage Type
New Conventional
Purchase Details
Closed on
Apr 20, 1999
Sold by
Glory George W and Glory Diana L
Bought by
Glory George W
Home Financials for this Owner
Home Financials are based on the most recent Mortgage that was taken out on this home.
Original Mortgage
$14,179
Interest Rate
7.1%
Purchase Details
Closed on
Oct 27, 1998
Sold by
Glory Darrilyn B and Glory Darrilyn
Bought by
Glory George William
Home Financials for this Owner
Home Financials are based on the most recent Mortgage that was taken out on this home.
Original Mortgage
$74,400
Interest Rate
6.54%
Create a Home Valuation Report for This Property
The Home Valuation Report is an in-depth analysis detailing your home's value as well as a comparison with similar homes in the area
Home Values in the Area
Average Home Value in this Area
Purchase History
| Date | Buyer | Sale Price | Title Company |
|---|---|---|---|
| Glory George W | -- | Chicago Title Company | |
| Glory George W | -- | First American Title Co | |
| Glory George William | -- | Chicago Title Co |
Source: Public Records
Mortgage History
| Date | Status | Borrower | Loan Amount |
|---|---|---|---|
| Closed | Glory George W | $50,000 | |
| Closed | Glory George W | $14,179 | |
| Closed | Glory George William | $74,400 |
Source: Public Records
Tax History Compared to Growth
Tax History
| Year | Tax Paid | Tax Assessment Tax Assessment Total Assessment is a certain percentage of the fair market value that is determined by local assessors to be the total taxable value of land and additions on the property. | Land | Improvement |
|---|---|---|---|---|
| 2025 | $1,818 | $178,463 | $29,585 | $148,878 |
| 2023 | $1,818 | $171,535 | $28,437 | $143,098 |
| 2022 | $1,777 | $168,173 | $27,880 | $140,293 |
| 2021 | $1,738 | $164,877 | $27,334 | $137,543 |
| 2020 | $1,755 | $163,187 | $27,054 | $136,133 |
| 2019 | $1,724 | $159,988 | $26,524 | $133,464 |
| 2018 | $1,673 | $156,851 | $26,004 | $130,847 |
| 2017 | $1,646 | $153,775 | $25,494 | $128,281 |
| 2016 | $1,623 | $150,760 | $24,994 | $125,766 |
| 2015 | $1,612 | $148,496 | $24,619 | $123,877 |
| 2014 | $1,579 | $145,587 | $24,137 | $121,450 |
Source: Public Records
Map
Nearby Homes
- 2024 Neill Way
- 841 Moffat Dr
- 956 Clover Ln
- 920 Moffat Dr
- 860 E Grangeville Blvd
- 860 E Grangeville Blvd Unit 98
- 860 E Grangeville Blvd Unit 11
- 860 E Grangeville Blvd Unit 23
- 860 E Grangeville Blvd Unit 117
- 860 E Grangeville Blvd Unit 166
- 852 E Grangeville Blvd Unit 98
- 852 E Grangeville Blvd Unit 6
- 1807 Hardcastle Ave
- 2123 Cottonwood Ct
- 2055 N Burl Dr
- 0 E Grangeville Blvd
- 2202 Cottonwood Ct
- 2094 N Burl Dr
- 2015 N Burl Dr
- 1901 N Kensington Way
- 2001 Candlewood Ln
- 887 Clover Ln
- 883 Clover Ln
- 2009 Candlewood Ln
- 1990 Neill Way
- 892 Clover Ln
- 884 Clover Ln
- 1978 Neill Way
- 875 Clover Ln
- 2015 Candlewood Ln
- 2000 Neill Way
- 1942 Neill Ct
- 1956 Neill Way
- 2008 Neill Way
- 869 Clover Ln
- 876 Clover Ln
- 2010 Neill Way
- 885 Moffat Dr
- 899 Moffat Dr
- 873 Moffat Dr