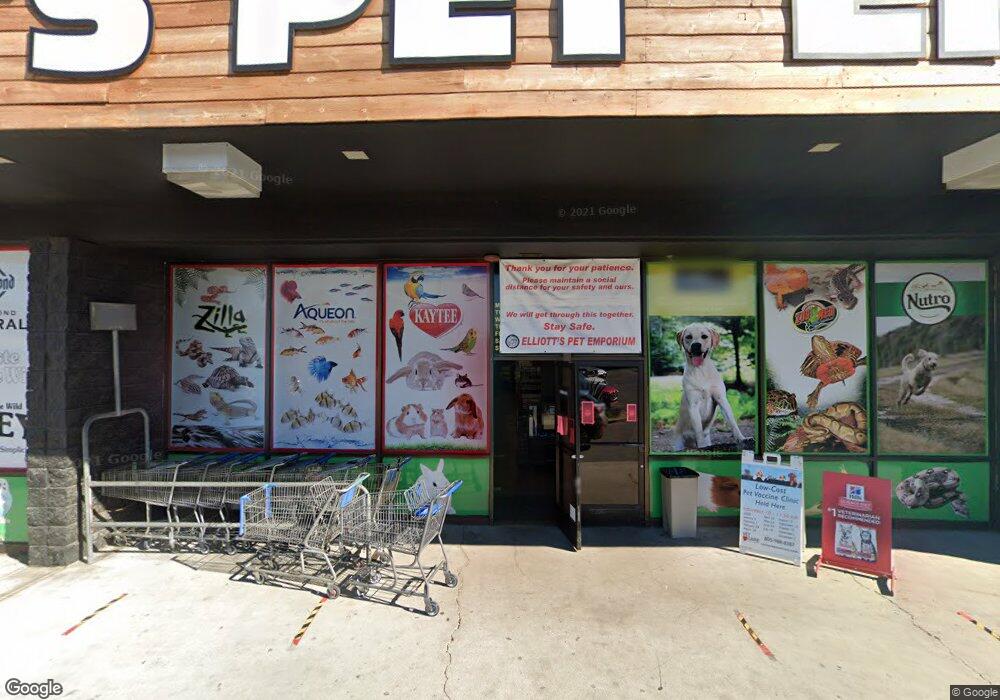
891 S E St San Bernardino, CA 92408
Estimated Value: $3,104,410
--
Bed
--
Bath
17,716
Sq Ft
$175/Sq Ft
Est. Value
About This Home
This home is located at 891 S E St, San Bernardino, CA 92408 and is currently estimated at $3,104,410, approximately $175 per square foot. 891 S E St is a home located in San Bernardino County with nearby schools including H. Frank Dominguez Elementary School, Curtis Middle School, and Indian Springs High.
Ownership History
Date
Name
Owned For
Owner Type
Purchase Details
Closed on
Dec 31, 2024
Sold by
Mersho Grjt Investments Llc
Bought by
Mershop E Street Llc
Current Estimated Value
Purchase Details
Closed on
Sep 28, 2017
Sold by
891 South E Street Llc
Bought by
Mersho Grjt Investments Llc
Purchase Details
Closed on
May 12, 2017
Sold by
Asbury Properties Inc
Bought by
891 South E St Llc
Home Financials for this Owner
Home Financials are based on the most recent Mortgage that was taken out on this home.
Original Mortgage
$1,000,000
Interest Rate
4.1%
Mortgage Type
Commercial
Create a Home Valuation Report for This Property
The Home Valuation Report is an in-depth analysis detailing your home's value as well as a comparison with similar homes in the area
Home Values in the Area
Average Home Value in this Area
Purchase History
| Date | Buyer | Sale Price | Title Company |
|---|---|---|---|
| Mershop E Street Llc | -- | None Listed On Document | |
| Mersho Grjt Investments Llc | $1,800,000 | Chicago Title Company | |
| 891 South E St Llc | $1,500,000 | Chicago Title Company |
Source: Public Records
Mortgage History
| Date | Status | Borrower | Loan Amount |
|---|---|---|---|
| Previous Owner | 891 South E St Llc | $1,000,000 |
Source: Public Records
Tax History Compared to Growth
Tax History
| Year | Tax Paid | Tax Assessment Tax Assessment Total Assessment is a certain percentage of the fair market value that is determined by local assessors to be the total taxable value of land and additions on the property. | Land | Improvement |
|---|---|---|---|---|
| 2025 | $25,098 | $2,048,094 | $372,071 | $1,676,023 |
| 2024 | $25,098 | $2,007,935 | $364,775 | $1,643,160 |
| 2023 | $24,474 | $1,968,564 | $357,623 | $1,610,941 |
| 2022 | $24,549 | $1,929,965 | $350,611 | $1,579,354 |
| 2021 | $24,624 | $1,892,122 | $343,736 | $1,548,386 |
| 2020 | $24,719 | $1,872,720 | $340,211 | $1,532,509 |
| 2019 | $23,955 | $1,836,000 | $333,540 | $1,502,460 |
| 2018 | $18,415 | $1,397,400 | $444,312 | $953,088 |
| 2017 | $17,847 | $1,370,000 | $435,600 | $934,400 |
| 2016 | $16,753 | $1,299,500 | $397,100 | $902,400 |
| 2015 | $15,228 | $1,152,000 | $352,000 | $800,000 |
| 2014 | $15,100 | $1,152,000 | $352,000 | $800,000 |
Source: Public Records
Map
Nearby Homes
- 0 S Washington Ave Unit IV25083098
- 0 S Berkeley St
- 1245 S Washington Ave
- 0 S Amos St
- 0 S Brookside St
- 0 N Wheeler Ln Unit PW25226133
- 374 E Norman Rd
- 1385 Orange Grove Ave
- 0 S Foisy St Unit IV25120777
- 976 S Foisy St
- 0 No Address Unit OC25190168
- 859 Vine St
- 0 W Velarde St Unit HD24195844
- 1037 Virginia Ave
- 566 E Santa fe St
- 1475 N Holly Ave
- 0 W Fairway Dr
- 603 San Jacinto St
- 1338 N Mount Vernon Ave
- 0 N Mountain View Ave
- 955 S E St Unit C
- 955 S E St Unit F
- 955 S E St Unit D
- 955 S E St Unit B
- 955 S E St
- 0 W Benedict Rd
- 999 S E St
- 194 W Benedict Rd
- 650 S E St Unit H
- 650 S E St Unit C
- 650 S E St Unit H3
- 650 S E St Unit B
- 650 S E St
- 650 S E
- 650 S E # B St
- 500 Inland Center Dr
- 500 Inland Center Dr Unit 156
- 500 Inland Center Dr Unit 350
- 360 Orange Show Ln
- 1101 S E St