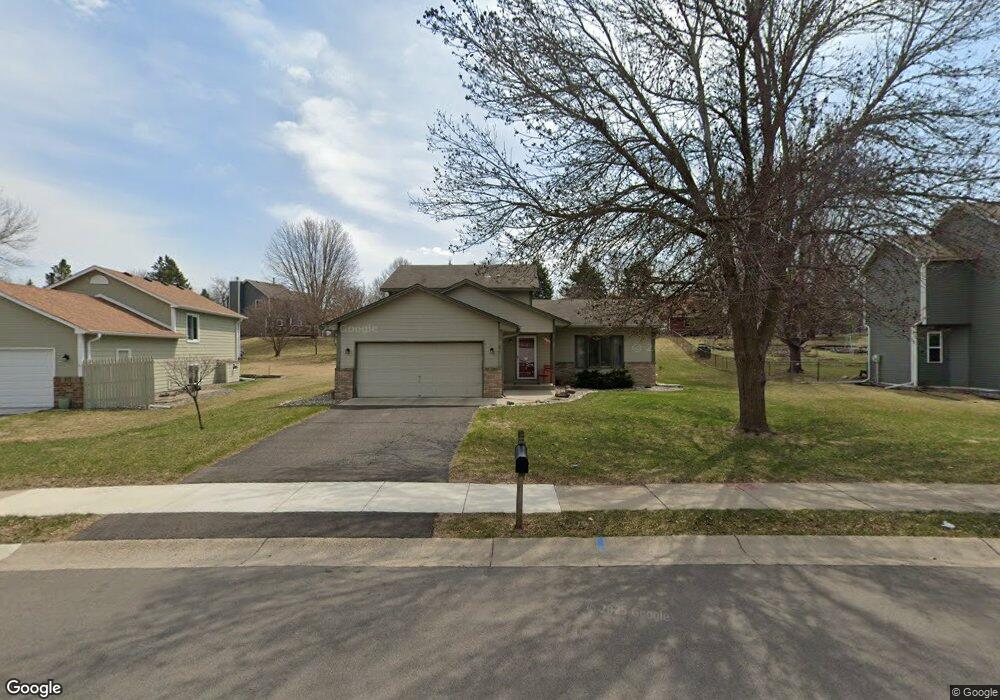
891 Saddlebrook Pass Chanhassen, MN 55317
Estimated Value: $398,000 - $445,000
3
Beds
2
Baths
1,120
Sq Ft
$379/Sq Ft
Est. Value
About This Home
This home is located at 891 Saddlebrook Pass, Chanhassen, MN 55317 and is currently estimated at $424,634, approximately $379 per square foot. 891 Saddlebrook Pass is a home located in Carver County with nearby schools including Chanhassen Elementary School, Pioneer Ridge Middle School, and Chanhassen High School.
Ownership History
Date
Name
Owned For
Owner Type
Purchase Details
Closed on
Nov 6, 2015
Sold by
Anderson Peter J and Anderson Jill M
Bought by
Anderson Peter J and Anderson Jill M
Current Estimated Value
Home Financials for this Owner
Home Financials are based on the most recent Mortgage that was taken out on this home.
Original Mortgage
$215,200
Outstanding Balance
$169,437
Interest Rate
3.82%
Mortgage Type
New Conventional
Estimated Equity
$255,197
Purchase Details
Closed on
Nov 29, 2004
Sold by
Mcpherson Daniel W and Wilde Mcpherson Tanya
Bought by
Anderson Peter J
Purchase Details
Closed on
Jun 29, 2000
Sold by
Wigen John M and Wigen Julie A
Bought by
Mcpherson Daniel W and Mcpherson Tanya Wilde
Purchase Details
Closed on
Jan 29, 1998
Sold by
Jeffrey Christopher M
Bought by
Heiss Julie A and Wigen John M
Purchase Details
Closed on
May 3, 1996
Sold by
Hagen Robert P
Bought by
Jeffrey Christopher M
Create a Home Valuation Report for This Property
The Home Valuation Report is an in-depth analysis detailing your home's value as well as a comparison with similar homes in the area
Home Values in the Area
Average Home Value in this Area
Purchase History
| Date | Buyer | Sale Price | Title Company |
|---|---|---|---|
| Anderson Peter J | -- | Gibraltar Title Agency Llc | |
| Anderson Peter J | $260,487 | -- | |
| Mcpherson Daniel W | $195,500 | -- | |
| Heiss Julie A | $140,000 | -- | |
| Jeffrey Christopher M | $136,500 | -- |
Source: Public Records
Mortgage History
| Date | Status | Borrower | Loan Amount |
|---|---|---|---|
| Open | Anderson Peter J | $215,200 |
Source: Public Records
Tax History Compared to Growth
Tax History
| Year | Tax Paid | Tax Assessment Tax Assessment Total Assessment is a certain percentage of the fair market value that is determined by local assessors to be the total taxable value of land and additions on the property. | Land | Improvement |
|---|---|---|---|---|
| 2025 | $3,644 | $382,100 | $140,000 | $242,100 |
| 2024 | $3,654 | $362,100 | $140,000 | $222,100 |
| 2023 | $3,610 | $358,200 | $140,000 | $218,200 |
| 2022 | $3,466 | $357,300 | $139,200 | $218,100 |
| 2021 | $3,360 | $302,800 | $116,000 | $186,800 |
| 2020 | $3,412 | $300,100 | $116,000 | $184,100 |
| 2019 | $3,374 | $284,900 | $110,500 | $174,400 |
| 2018 | $3,010 | $284,900 | $110,500 | $174,400 |
| 2017 | $3,188 | $250,700 | $96,100 | $154,600 |
| 2016 | $3,352 | $242,300 | $0 | $0 |
| 2015 | $2,958 | $244,200 | $0 | $0 |
| 2014 | $2,958 | $198,500 | $0 | $0 |
Source: Public Records
Map
Nearby Homes
- 760 Bighorn Dr
- 7104 Pontiac Cir
- 1003 Pontiac Ln
- 7291 Pontiac Cir
- 1042 Pontiac Ln
- 710 W Village Rd Unit 105
- 7639 Nicholas Way
- 7406 Laredo Dr
- 7719 Nicholas Way
- 601 Fox Hill Dr
- 834 Cree Dr
- 5523 Game Farm Lookout
- 1000 Carver Beach Rd
- 6690 Nez Perce Dr
- 303 W 77th St
- 1350 Heather Ct
- 7602 Erie Ave
- 6620 Horseshoe Curve
- 970 Pleasantview Rd
- 460 Indian Hill Rd
- 881 Saddlebrook Pass
- 901 Saddlebrook Pass
- 920 Saddlebrook Pass
- 911 Saddlebrook Pass
- 930 Saddlebrook Pass
- 7300 Trotters Cir
- 7310 Trotters Cir
- 910 Saddlebrook Pass
- 7320 Trotters Cir
- 7271 Trotters Cir
- 920 Saddlebrook Trail
- 7281 Trotters Cir
- 900 Saddlebrook Pass
- 7330 Trotters Cir
- 910 Saddlebrook Trail
- 910 Saddlebrook Trail
- 7291 Trotters Cir
- 890 Saddlebrook Pass
- 7301 Trotters Cir
- 950 Saddlebrook Trail