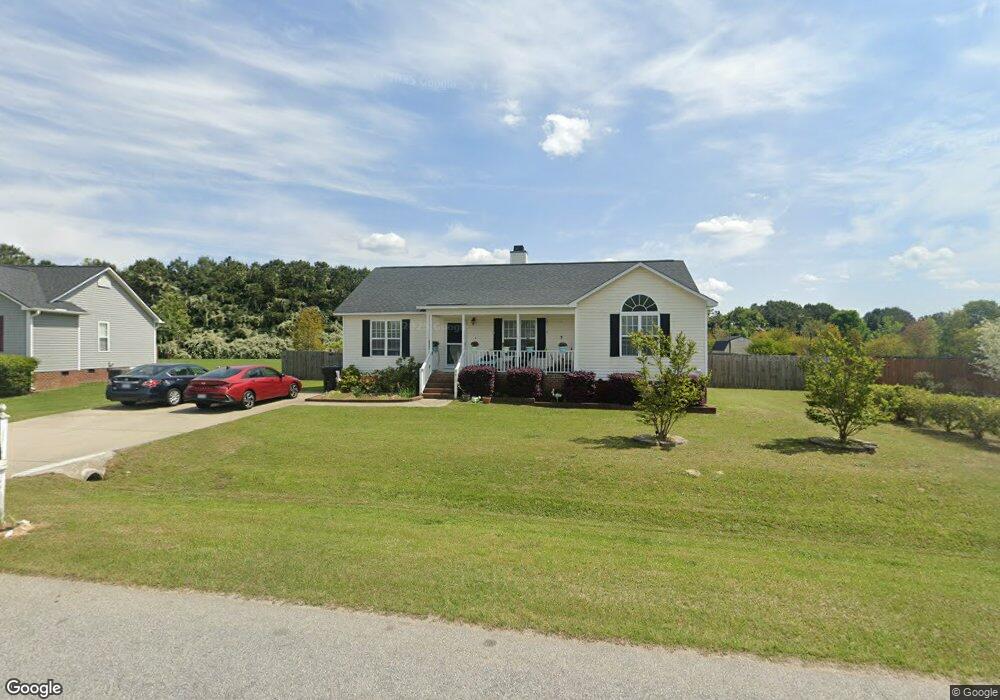
8912 Deep Well Dr Willow Spring, NC 27592
Estimated Value: $308,000 - $323,622
3
Beds
2
Baths
1,438
Sq Ft
$220/Sq Ft
Est. Value
About This Home
This home is located at 8912 Deep Well Dr, Willow Spring, NC 27592 and is currently estimated at $315,906, approximately $219 per square foot. 8912 Deep Well Dr is a home located in Wake County with nearby schools including Willow Springs Elementary School and Carolina Charter Academy.
Ownership History
Date
Name
Owned For
Owner Type
Purchase Details
Closed on
Nov 19, 2012
Sold by
Pierce Investments Llc
Bought by
Balletta Robert John and Balletta Dianne
Current Estimated Value
Purchase Details
Closed on
Sep 5, 2012
Sold by
Secretary Of Housing & Urban Development
Bought by
Pierce Investments Llc
Home Financials for this Owner
Home Financials are based on the most recent Mortgage that was taken out on this home.
Original Mortgage
$68,256
Interest Rate
3.53%
Mortgage Type
Purchase Money Mortgage
Purchase Details
Closed on
May 25, 2012
Sold by
Portales Jose Javier and Contreras Alma Delia
Bought by
Secretary Of Housing & Urban Development
Purchase Details
Closed on
Dec 22, 2005
Sold by
Comfort Homes Inc
Bought by
Portales Jose Javier and Contreras Alma Delia
Home Financials for this Owner
Home Financials are based on the most recent Mortgage that was taken out on this home.
Original Mortgage
$133,827
Interest Rate
6.29%
Mortgage Type
FHA
Create a Home Valuation Report for This Property
The Home Valuation Report is an in-depth analysis detailing your home's value as well as a comparison with similar homes in the area
Home Values in the Area
Average Home Value in this Area
Purchase History
| Date | Buyer | Sale Price | Title Company |
|---|---|---|---|
| Balletta Robert John | $127,000 | None Available | |
| Pierce Investments Llc | -- | None Available | |
| Secretary Of Housing & Urban Development | $99,200 | None Available | |
| Portales Jose Javier | $135,000 | None Available |
Source: Public Records
Mortgage History
| Date | Status | Borrower | Loan Amount |
|---|---|---|---|
| Previous Owner | Pierce Investments Llc | $68,256 | |
| Previous Owner | Portales Jose Javier | $133,827 |
Source: Public Records
Tax History
| Year | Tax Paid | Tax Assessment Tax Assessment Total Assessment is a certain percentage of the fair market value that is determined by local assessors to be the total taxable value of land and additions on the property. | Land | Improvement |
|---|---|---|---|---|
| 2025 | -- | $291,826 | $80,000 | $211,826 |
| 2024 | $1,832 | $291,826 | $80,000 | $211,826 |
Source: Public Records
Map
Nearby Homes
- 8701 Maxine St
- 2829 Arrowsmith Dr
- 1425 Country Pond Ln
- 8808 Tartan Clan Dr
- 545 Freedom Trail Dr
- 2805 Mary Marvin Trail
- 574 Freedom Trail Dr
- 573 Freedom Trail Dr
- 569 Freedom Trail Dr
- 821 Walker Ridge Way
- 801 Walker Ridge Way
- 868 Walker Ridge Way
- 817 Walker Ridge Way
- 832 Walker Ridge Way
- 508 Freedom Trail Dr
- 488 Freedom Trail Dr
- 562 Freedom Trail Dr
- 829 Walker Ridge Way
- 849 Walker Ridge Way
- 845 Walker Ridge Way
- 8908 Deep Well Dr
- 8909 Deep Well Dr
- 8920 Deep Well Dr
- 8904 Deep Well Dr
- 8921 Deep Well Dr
- 8928 Deep Well Dr
- 8925 Deep Well Dr
- 8908 Kennebec Rd
- 8900 Deep Well Dr
- 8912 Kennebec Rd
- 7809 Heavenly Place
- 8904 Kennebec Rd
- 8936 Deep Well Dr
- 8929 Deep Well Dr
- 8916 Kennebec Rd Unit 68
- 8916 Kennebec Rd
- 8918 Kennebec Rd Unit 69
- 7913 Heavenly Place
- 8944 Deep Well Dr
- 8829 Buckshot Ln
Your Personal Tour Guide
Ask me questions while you tour the home.