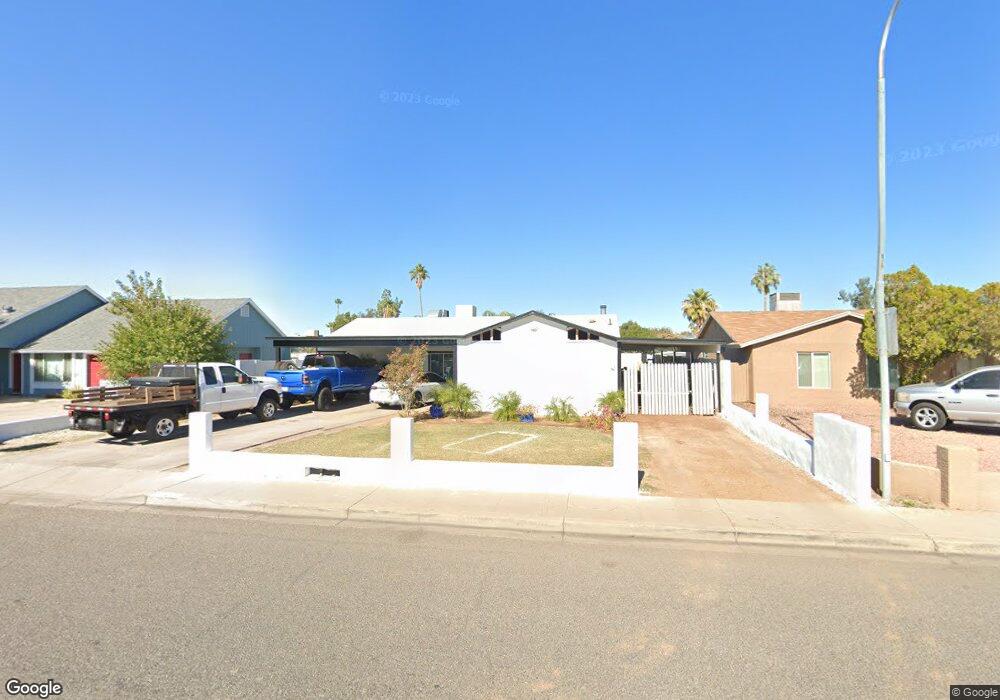
8912 W Osborn Rd Phoenix, AZ 85037
Estimated Value: $303,472 - $366,000
--
Bed
2
Baths
1,496
Sq Ft
$230/Sq Ft
Est. Value
About This Home
This home is located at 8912 W Osborn Rd, Phoenix, AZ 85037 and is currently estimated at $344,118, approximately $230 per square foot. 8912 W Osborn Rd is a home located in Maricopa County with nearby schools including Pendergast Elementary School, Copper Canyon High School, and Pan-American Charter School.
Ownership History
Date
Name
Owned For
Owner Type
Purchase Details
Closed on
May 10, 2019
Sold by
Ramos Juan
Bought by
Camacho Sipriana Arredondo
Current Estimated Value
Home Financials for this Owner
Home Financials are based on the most recent Mortgage that was taken out on this home.
Original Mortgage
$144,500
Outstanding Balance
$126,526
Interest Rate
4%
Mortgage Type
Purchase Money Mortgage
Estimated Equity
$217,592
Purchase Details
Closed on
May 7, 2019
Sold by
Venard Michael A and Venard Christopher B
Bought by
Ramos Juan
Home Financials for this Owner
Home Financials are based on the most recent Mortgage that was taken out on this home.
Original Mortgage
$144,500
Outstanding Balance
$126,526
Interest Rate
4%
Mortgage Type
Purchase Money Mortgage
Estimated Equity
$217,592
Create a Home Valuation Report for This Property
The Home Valuation Report is an in-depth analysis detailing your home's value as well as a comparison with similar homes in the area
Home Values in the Area
Average Home Value in this Area
Purchase History
| Date | Buyer | Sale Price | Title Company |
|---|---|---|---|
| Camacho Sipriana Arredondo | $163,000 | Driggs Title Agency Inc | |
| Ramos Juan | $145,000 | American Title Svc Agcy Llc |
Source: Public Records
Mortgage History
| Date | Status | Borrower | Loan Amount |
|---|---|---|---|
| Open | Camacho Sipriana Arredondo | $144,500 |
Source: Public Records
Tax History Compared to Growth
Tax History
| Year | Tax Paid | Tax Assessment Tax Assessment Total Assessment is a certain percentage of the fair market value that is determined by local assessors to be the total taxable value of land and additions on the property. | Land | Improvement |
|---|---|---|---|---|
| 2025 | $1,211 | $7,488 | -- | -- |
| 2024 | $1,103 | $7,131 | -- | -- |
| 2023 | $1,103 | $23,930 | $4,780 | $19,150 |
| 2022 | $1,061 | $18,780 | $3,750 | $15,030 |
| 2021 | $1,017 | $16,910 | $3,380 | $13,530 |
| 2020 | $988 | $15,630 | $3,120 | $12,510 |
| 2019 | $980 | $13,830 | $2,760 | $11,070 |
| 2018 | $826 | $12,610 | $2,520 | $10,090 |
| 2017 | $770 | $10,710 | $2,140 | $8,570 |
| 2016 | $705 | $9,220 | $1,840 | $7,380 |
| 2015 | $686 | $8,130 | $1,620 | $6,510 |
Source: Public Records
Map
Nearby Homes
- 8834 W Osborn Rd
- 8902 W Columbus Ave
- 8822 W Whitton Ave
- 8920 W Monterey Way
- 9028 W Osborn Rd
- 9021 W Mulberry Dr
- 3109 N 89th Dr Unit 1
- 8807 W Clarendon Ave
- 8921 W Fairmount Ave
- 3218 N 98th Ln
- 3636 N 86th Ln
- 8719 W Avalon Dr
- 8658 W Earll Dr
- 3432 N 86th Ave
- 9552 W Piccadilly Rd
- 9606 W Piccadilly Rd
- 8623 W Indianola Ave
- 3630 N 86th Ave
- 8524 W Weldon Ave
- 8925 W Monterosa St
- 8918 W Osborn Rd
- 8908 W Osborn Rd
- 3412 N 89th Ave
- 8922 W Osborn Rd
- 8902 W Osborn Rd
- 8923 W Whitton Ave
- 8913 W Osborn Rd
- 8909 W Osborn Rd
- 3418 N 89th Ave Unit 3
- 8918 W Whitton Ave
- 8917 W Osborn Rd
- 8905 W Osborn Rd
- 8928 W Osborn Rd
- 8921 W Osborn Rd
- 8901 W Osborn Rd
- 8929 W Whitton Ave
- 3424 N 89th Ave
- 8925 W Osborn Rd
- 8858 W Osborn Rd Unit 3
- 8934 W Osborn Rd