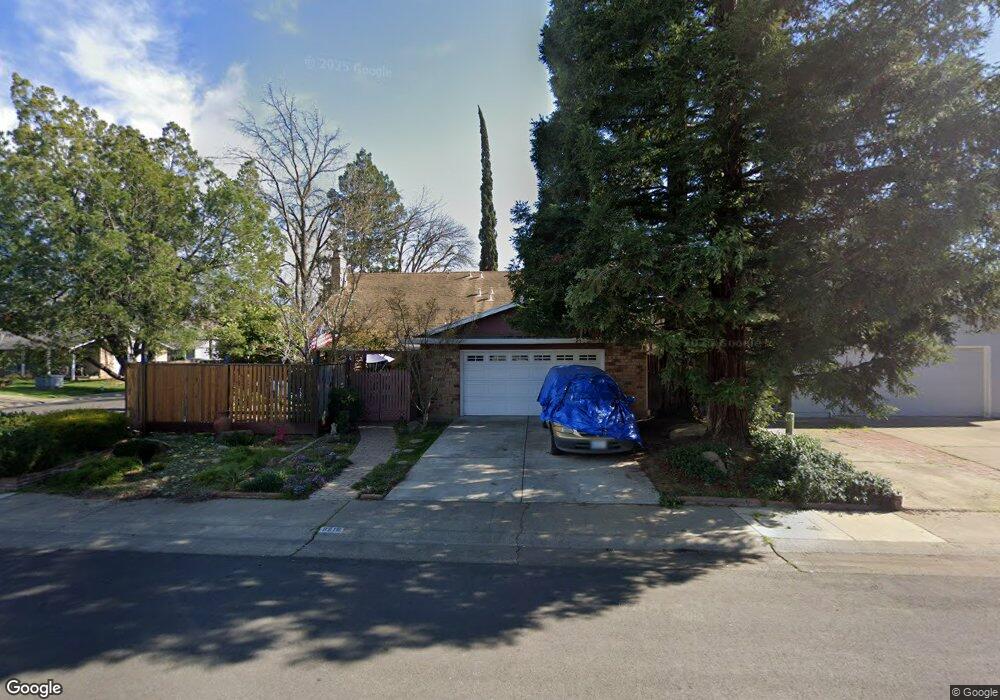
8916 Trujillo Way Sacramento, CA 95826
Rosemont NeighborhoodEstimated Value: $388,000 - $528,000
5
Beds
3
Baths
1,640
Sq Ft
$297/Sq Ft
Est. Value
About This Home
This home is located at 8916 Trujillo Way, Sacramento, CA 95826 and is currently estimated at $487,849, approximately $297 per square foot. 8916 Trujillo Way is a home located in Sacramento County with nearby schools including Sequoia Elementary, Albert Einstein Middle School, and Rosemont High School.
Ownership History
Date
Name
Owned For
Owner Type
Purchase Details
Closed on
Mar 19, 2024
Sold by
Fengel George H
Bought by
Fengel Family Revocable Trust and Fengel
Current Estimated Value
Home Financials for this Owner
Home Financials are based on the most recent Mortgage that was taken out on this home.
Original Mortgage
$116,684
Outstanding Balance
$109,275
Interest Rate
6.22%
Mortgage Type
VA
Estimated Equity
$378,574
Purchase Details
Closed on
Feb 5, 2024
Sold by
Fengel Family Revocable Trust
Bought by
Fengel George H
Home Financials for this Owner
Home Financials are based on the most recent Mortgage that was taken out on this home.
Original Mortgage
$116,684
Outstanding Balance
$109,275
Interest Rate
6.22%
Mortgage Type
VA
Estimated Equity
$378,574
Purchase Details
Closed on
May 14, 2004
Sold by
Fengel George H and Fengel Sandra C
Bought by
Fengel George H and Fengel Sandra C
Create a Home Valuation Report for This Property
The Home Valuation Report is an in-depth analysis detailing your home's value as well as a comparison with similar homes in the area
Home Values in the Area
Average Home Value in this Area
Purchase History
| Date | Buyer | Sale Price | Title Company |
|---|---|---|---|
| Fengel Family Revocable Trust | -- | None Listed On Document | |
| Fengel Family Revocable Trust | -- | None Listed On Document | |
| Fengel George H | -- | None Listed On Document | |
| Fengel George H | -- | None Listed On Document | |
| Fengel George H | -- | -- |
Source: Public Records
Mortgage History
| Date | Status | Borrower | Loan Amount |
|---|---|---|---|
| Open | Fengel Family Revocable Trust | $116,684 | |
| Closed | Fengel Family Revocable Trust | $116,684 |
Source: Public Records
Tax History Compared to Growth
Tax History
| Year | Tax Paid | Tax Assessment Tax Assessment Total Assessment is a certain percentage of the fair market value that is determined by local assessors to be the total taxable value of land and additions on the property. | Land | Improvement |
|---|---|---|---|---|
| 2025 | $1,367 | $109,275 | $19,578 | $89,697 |
| 2024 | $1,367 | $107,134 | $19,195 | $87,939 |
| 2023 | $1,334 | $105,034 | $18,819 | $86,215 |
| 2022 | $1,309 | $102,975 | $18,450 | $84,525 |
| 2021 | $1,250 | $100,957 | $18,089 | $82,868 |
| 2020 | $1,256 | $99,923 | $17,904 | $82,019 |
| 2019 | $1,228 | $97,964 | $17,553 | $80,411 |
| 2018 | $1,196 | $96,044 | $17,209 | $78,835 |
| 2017 | $1,178 | $94,162 | $16,872 | $77,290 |
| 2016 | $1,076 | $92,317 | $16,542 | $75,775 |
| 2015 | $1,060 | $90,931 | $16,294 | $74,637 |
| 2014 | $1,031 | $89,150 | $15,975 | $73,175 |
Source: Public Records
Map
Nearby Homes
- 9021 Thilow Dr
- 9048 Posada Way
- 9057 Caldera Way
- 9059 Pinata Way Unit 4
- 9005 Montoya St Unit 2
- 8964 Sutters Gold Dr
- 9029 Montoya St
- 9041 Montoya St Unit 1
- 9075 Montoya St Unit 2
- 8929 Red Leaf Way
- 2856 Norcade Cir
- 9125 Trujillo Way
- 3361 Brunner Dr
- 3024 Tamango Way
- 8844 Garden Glen Way
- 9157 Trujillo Way
- 3540 Imperial Way
- 2570 Warrego Way
- 3449 Buccaneer Cir
- 9016 Kiefer Blvd
- 8912 Trujillo Way
- 3008 Roman Ct
- 3001 Roman Ct
- 8908 Trujillo Way
- 3005 Roman Ct
- 8915 Trujillo Way
- 8919 Trujillo Way
- 3012 Roman Ct
- 8911 Trujillo Way
- 8923 Trujillo Way
- 3009 Roman Ct
- 8907 Trujillo Way
- 8927 Trujillo Way
- 3016 Roman Ct
- 3013 Roman Ct
- 3000 Tango St
- 3004 Tango St
- 8931 Trujillo Way
- 3008 Tango St
- 3017 Roman Ct