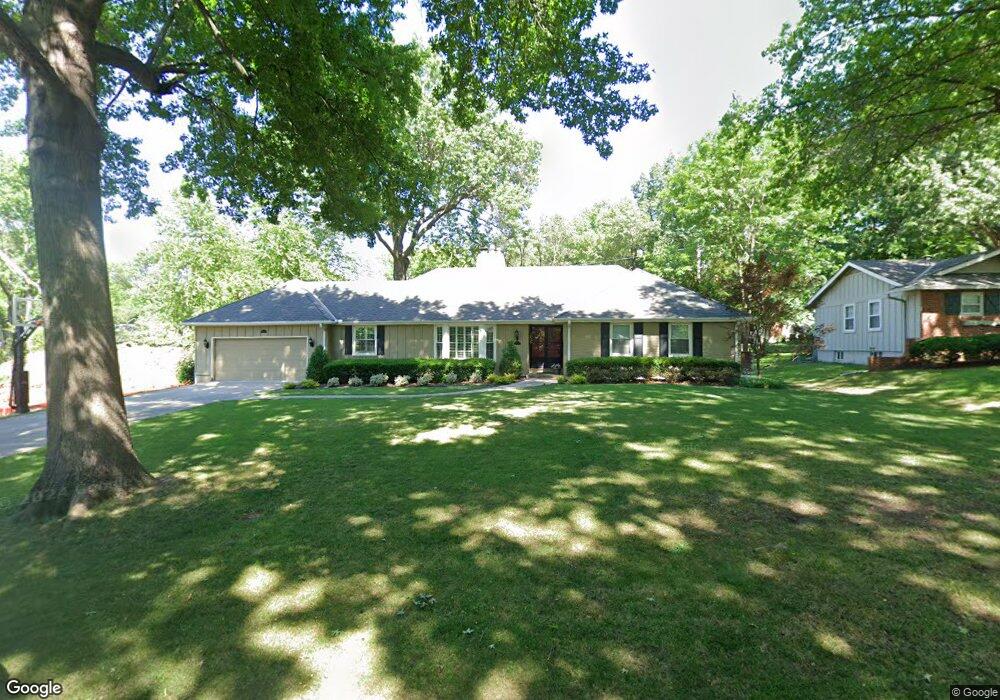
8919 Mohawk Ln Leawood, KS 66206
Estimated Value: $641,000 - $831,000
3
Beds
3
Baths
1,894
Sq Ft
$380/Sq Ft
Est. Value
About This Home
This home is located at 8919 Mohawk Ln, Leawood, KS 66206 and is currently estimated at $719,123, approximately $379 per square foot. 8919 Mohawk Ln is a home located in Johnson County with nearby schools including Indian Hills Middle School, Shawnee Mission East High School, and Cure' of Ars Catholic School.
Ownership History
Date
Name
Owned For
Owner Type
Purchase Details
Closed on
Jan 28, 2019
Sold by
Levitan Michael and Levitan Kimberly
Bought by
Levitan Kimberly
Current Estimated Value
Purchase Details
Closed on
Apr 29, 2005
Sold by
Watson Todd and Watson Katherine
Bought by
Levitan Michael A and Levitan Kimberly D
Home Financials for this Owner
Home Financials are based on the most recent Mortgage that was taken out on this home.
Original Mortgage
$72,000
Outstanding Balance
$54,013
Interest Rate
5.92%
Mortgage Type
Credit Line Revolving
Estimated Equity
$665,110
Purchase Details
Closed on
Jul 13, 2001
Sold by
Payne Robert E
Bought by
Watson Todd and Watson Katherine
Home Financials for this Owner
Home Financials are based on the most recent Mortgage that was taken out on this home.
Original Mortgage
$168,000
Interest Rate
7.2%
Create a Home Valuation Report for This Property
The Home Valuation Report is an in-depth analysis detailing your home's value as well as a comparison with similar homes in the area
Home Values in the Area
Average Home Value in this Area
Purchase History
| Date | Buyer | Sale Price | Title Company |
|---|---|---|---|
| Levitan Kimberly | -- | None Available | |
| Levitan Michael A | -- | Kansas City Title | |
| Watson Todd | -- | Chicago Title Insurance Co |
Source: Public Records
Mortgage History
| Date | Status | Borrower | Loan Amount |
|---|---|---|---|
| Open | Levitan Michael A | $72,000 | |
| Open | Levitan Michael A | $265,000 | |
| Previous Owner | Watson Todd | $168,000 |
Source: Public Records
Tax History
| Year | Tax Paid | Tax Assessment Tax Assessment Total Assessment is a certain percentage of the fair market value that is determined by local assessors to be the total taxable value of land and additions on the property. | Land | Improvement |
|---|---|---|---|---|
| 2025 | $8,038 | $77,625 | $33,824 | $43,801 |
| 2024 | $8,038 | $75,601 | $30,742 | $44,859 |
| 2023 | $7,714 | $72,105 | $27,940 | $44,165 |
| 2022 | $6,108 | $57,305 | $24,300 | $33,005 |
| 2021 | $6,199 | $55,799 | $24,300 | $31,499 |
| 2020 | $5,578 | $49,508 | $22,094 | $27,414 |
| 2019 | $5,062 | $45,080 | $18,417 | $26,663 |
| 2018 | $4,813 | $42,723 | $16,736 | $25,987 |
| 2017 | $4,903 | $42,837 | $12,867 | $29,970 |
| 2016 | $4,903 | $42,285 | $9,891 | $32,394 |
| 2015 | $4,764 | $41,423 | $9,891 | $31,532 |
| 2013 | -- | $40,653 | $8,246 | $32,407 |
Source: Public Records
Map
Nearby Homes
- 9000 Cherokee Ln
- 9001 Cherokee Ln
- 8909 Cherokee Ln
- 3521 W 92nd Place
- 3012 W 91st St
- 3520 W 93rd St
- 3004 W 91st St
- 2832 W 91st St
- 2819 W 89th St
- 9319 Mohawk Ln
- 9105 El Monte St
- 9312 Catalina St
- 9408 Wenonga Rd
- 8721 Ensley Ln
- 9222 Belinder Rd
- 9416 Cherokee Place
- 9428 Wenonga Rd
- 2908 W 94th St
- 4405 W 93rd St
- 2816 W 87th Terrace
Your Personal Tour Guide
Ask me questions while you tour the home.