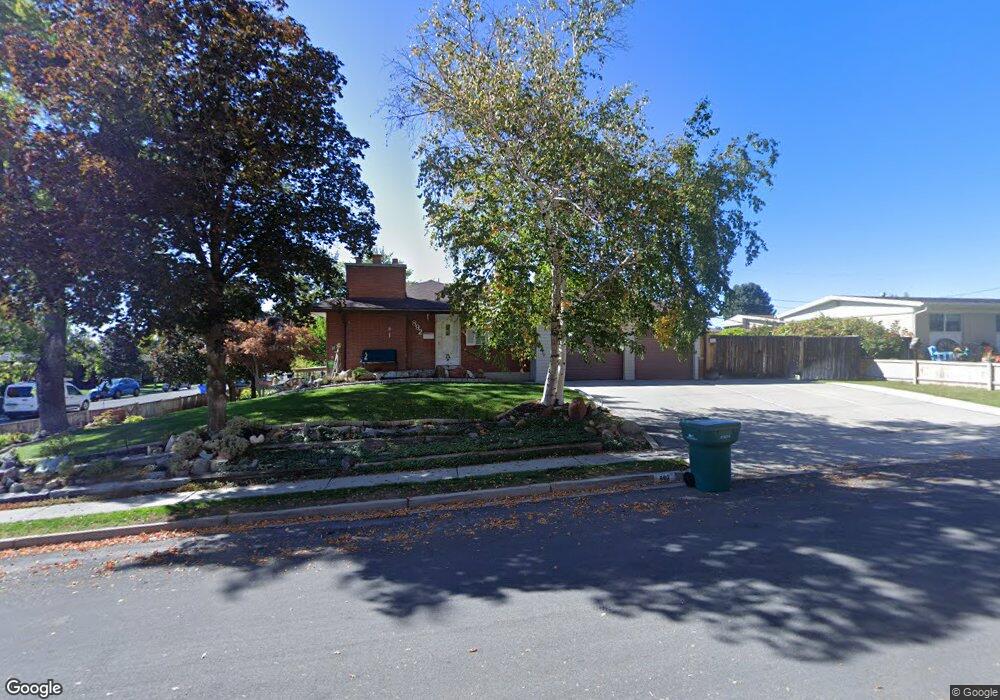
892 S 100 W Orem, UT 84058
Westmore NeighborhoodEstimated Value: $459,000 - $544,000
5
Beds
2
Baths
2,236
Sq Ft
$225/Sq Ft
Est. Value
About This Home
This home is located at 892 S 100 W, Orem, UT 84058 and is currently estimated at $503,739, approximately $225 per square foot. 892 S 100 W is a home located in Utah County with nearby schools including Westmore Elementary School, Lakeridge Jr High School, and Mountain View High School.
Ownership History
Date
Name
Owned For
Owner Type
Purchase Details
Closed on
Feb 13, 2024
Sold by
Louie P And Joyce T Notarianni Trust
Bought by
Richards Jack and Richards Rossalynn
Current Estimated Value
Purchase Details
Closed on
Dec 7, 2021
Sold by
Notarianni Louie P
Bought by
Louie P And Joyce T Notarianni Trust
Purchase Details
Closed on
Dec 1, 2009
Sold by
Notarianni Louie P and Notarianni Joyce T
Bought by
Notarianni Louie P and Notarianni Joyce T
Purchase Details
Closed on
Nov 5, 2003
Sold by
Davis Magda Miranda
Bought by
Dennis Stanley C and Dennis Magda Miranda
Create a Home Valuation Report for This Property
The Home Valuation Report is an in-depth analysis detailing your home's value as well as a comparison with similar homes in the area
Home Values in the Area
Average Home Value in this Area
Purchase History
| Date | Buyer | Sale Price | Title Company |
|---|---|---|---|
| Richards Jack | -- | Highland Title | |
| Louie P And Joyce T Notarianni Trust | -- | Tingey Law Group Pllc | |
| Notarianni Louie P | -- | None Available | |
| Dennis Stanley C | -- | Old Republic Title Company |
Source: Public Records
Tax History
| Year | Tax Paid | Tax Assessment Tax Assessment Total Assessment is a certain percentage of the fair market value that is determined by local assessors to be the total taxable value of land and additions on the property. | Land | Improvement |
|---|---|---|---|---|
| 2025 | $1,904 | $251,460 | -- | -- |
| 2024 | $1,904 | $232,760 | $0 | $0 |
| 2023 | $1,746 | $229,460 | $0 | $0 |
| 2022 | $1,734 | $220,825 | $0 | $0 |
| 2021 | $1,612 | $310,900 | $176,400 | $134,500 |
| 2020 | $1,440 | $273,000 | $141,100 | $131,900 |
| 2019 | $1,330 | $262,200 | $130,300 | $131,900 |
| 2018 | $1,238 | $233,100 | $112,200 | $120,900 |
| 2017 | $1,155 | $116,545 | $0 | $0 |
| 2016 | $1,117 | $103,895 | $0 | $0 |
| 2015 | $1,085 | $95,425 | $0 | $0 |
| 2014 | $1,071 | $93,775 | $0 | $0 |
Source: Public Records
Map
Nearby Homes
Your Personal Tour Guide
Ask me questions while you tour the home.