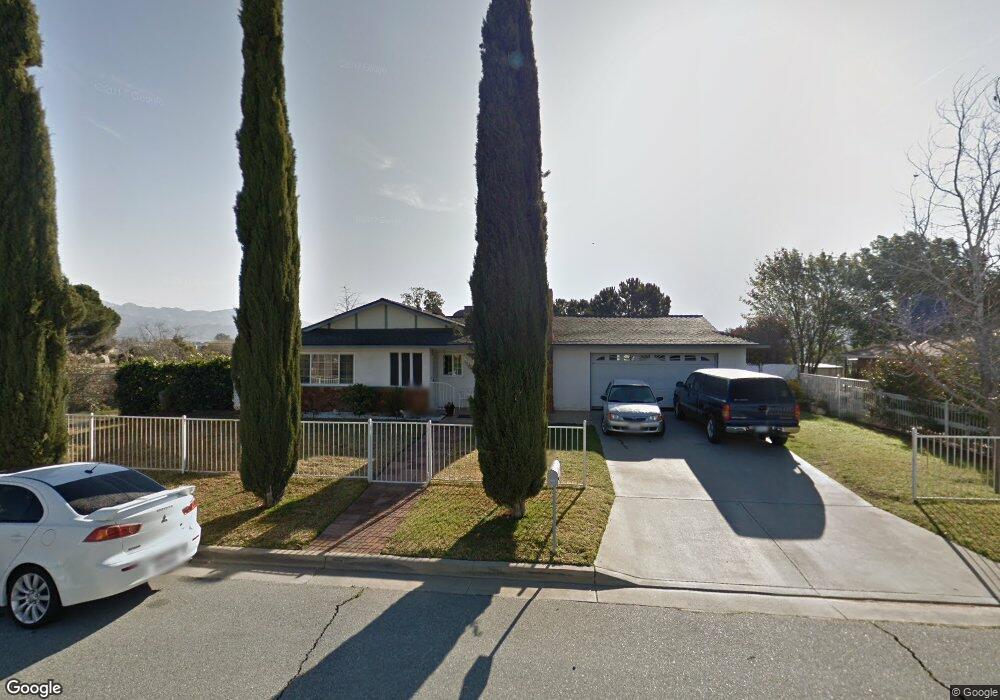
892 S 12th St Banning, CA 92220
Estimated Value: $440,873 - $508,000
3
Beds
2
Baths
1,642
Sq Ft
$282/Sq Ft
Est. Value
About This Home
This home is located at 892 S 12th St, Banning, CA 92220 and is currently estimated at $462,968, approximately $281 per square foot. 892 S 12th St is a home located in Riverside County with nearby schools including Banning High School.
Ownership History
Date
Name
Owned For
Owner Type
Purchase Details
Closed on
Nov 23, 2016
Sold by
Mccurdy Thomas L and Mccurdy Eva L
Bought by
Mccurdy Thomas L and Mccurdy Eva L
Current Estimated Value
Purchase Details
Closed on
Aug 18, 2016
Sold by
Mccurdy Thomas L and Mccurdy Eva L
Bought by
Mccurdy Thomas L and Mccurdy Eva L
Home Financials for this Owner
Home Financials are based on the most recent Mortgage that was taken out on this home.
Original Mortgage
$174,000
Outstanding Balance
$138,787
Interest Rate
3.47%
Mortgage Type
New Conventional
Estimated Equity
$324,181
Purchase Details
Closed on
Mar 18, 2006
Sold by
Mccurdy Thomas L and Mccurdy Eva L
Bought by
Mccurdy Thomas L and Mccurdy Eva L
Purchase Details
Closed on
Feb 24, 1994
Sold by
Cisneros Henry G
Bought by
Mccurdy Thomas L and Mccurdy Eva L
Home Financials for this Owner
Home Financials are based on the most recent Mortgage that was taken out on this home.
Original Mortgage
$84,048
Interest Rate
7.21%
Mortgage Type
FHA
Purchase Details
Closed on
Nov 2, 1993
Sold by
Sears Mtg Corp
Bought by
Hud
Create a Home Valuation Report for This Property
The Home Valuation Report is an in-depth analysis detailing your home's value as well as a comparison with similar homes in the area
Home Values in the Area
Average Home Value in this Area
Purchase History
| Date | Buyer | Sale Price | Title Company |
|---|---|---|---|
| Mccurdy Thomas L | -- | None Available | |
| Mccurdy Thomas L | -- | Entitle Insurance Company | |
| Mccurdy Thomas L | -- | None Available | |
| Mccurdy Thomas L | $85,045 | Chicago Title Company | |
| Hud | -- | First Southwestern Title Com |
Source: Public Records
Mortgage History
| Date | Status | Borrower | Loan Amount |
|---|---|---|---|
| Open | Mccurdy Thomas L | $174,000 | |
| Closed | Mccurdy Thomas L | $84,048 |
Source: Public Records
Tax History Compared to Growth
Tax History
| Year | Tax Paid | Tax Assessment Tax Assessment Total Assessment is a certain percentage of the fair market value that is determined by local assessors to be the total taxable value of land and additions on the property. | Land | Improvement |
|---|---|---|---|---|
| 2025 | $2,369 | $178,427 | $59,467 | $118,960 |
| 2023 | $2,369 | $171,500 | $57,158 | $114,342 |
| 2022 | $2,315 | $168,138 | $56,038 | $112,100 |
| 2021 | $2,269 | $164,842 | $54,940 | $109,902 |
| 2020 | $2,248 | $163,153 | $54,377 | $108,776 |
| 2019 | $2,211 | $159,955 | $53,311 | $106,644 |
| 2018 | $2,194 | $156,819 | $52,267 | $104,552 |
| 2017 | $2,157 | $153,745 | $51,243 | $102,502 |
| 2016 | $2,050 | $150,732 | $50,239 | $100,493 |
| 2015 | $2,019 | $148,471 | $49,486 | $98,985 |
| 2014 | $2,004 | $145,564 | $48,517 | $97,047 |
Source: Public Records
Map
Nearby Homes
- 1447 W Westward Ave
- 1574 W Lincoln St
- 612 S 22nd St
- 955 W Hays St
- 947 W Hays St
- 555 S 22nd St
- 501 W Ramsey St Unit 41
- 501 W Ramsey St Unit 19
- 1 Banning-Idyllwild Panoramic Hwy
- 0 Wesley St
- 579 W Livingston St
- 103 E Barbour St
- 1131 W Nicolet St
- 688 W Nicolet St
- 182 N 4th St
- 883 W Nicolet St
- 676 W Nicolet St
- 640 W Nicolet St
- 1253 Cottonwood Rd
- 0 Gorgonio Rd Unit SW25208341
- 918 S 12th St
- 1180 W Westward Ave
- 942 S 12th St
- 895 S 12th St
- 1224 W Westward Ave
- 921 S 12th St
- 978 S 12th St
- 1264 W Westward Ave
- 951 S 12th St
- 786 S 12th St
- 1145 W Westward Ave
- 892 April Ln
- 1087 W Westward Ave
- 1030 W Westward Ave
- 920 April Ln
- 989 S 12th St
- 773 S 12th St
- 1300 W Westward Ave
- 750 S 12th St
- 950 April Ln