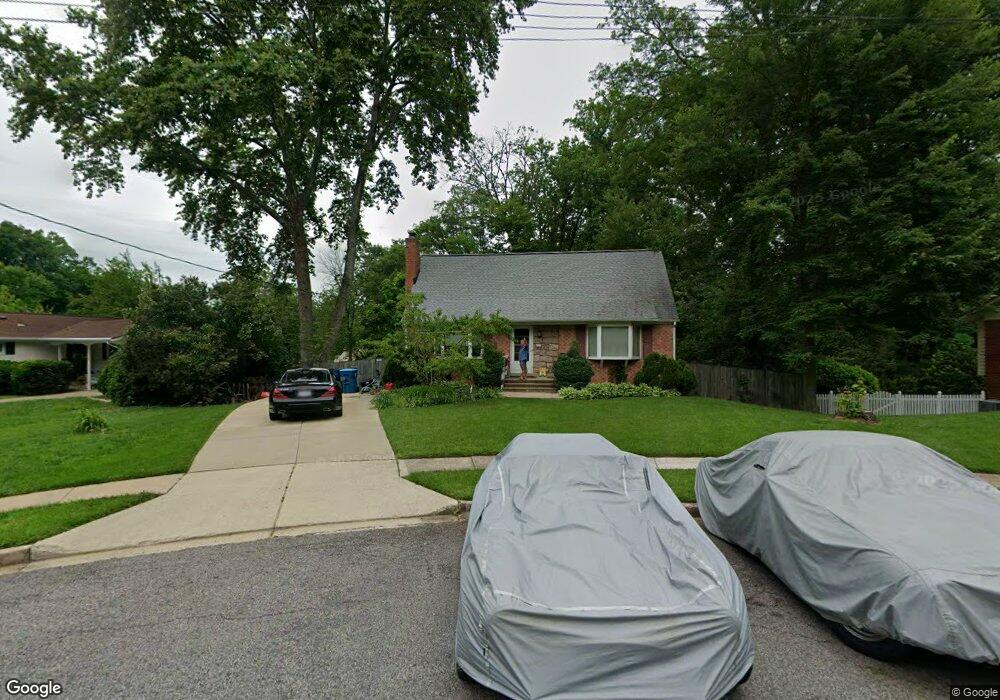
8923 Cromwell Dr Springfield, VA 22151
Estimated Value: $736,000 - $786,000
4
Beds
2
Baths
1,500
Sq Ft
$510/Sq Ft
Est. Value
About This Home
This home is located at 8923 Cromwell Dr, Springfield, VA 22151 and is currently estimated at $765,747, approximately $510 per square foot. 8923 Cromwell Dr is a home located in Fairfax County with nearby schools including Kings Park Elementary School, Kings Glen Elementary School, and Lake Braddock Secondary School.
Ownership History
Date
Name
Owned For
Owner Type
Purchase Details
Closed on
Jul 20, 2020
Sold by
Stone Drew B and Silva Dawn H
Bought by
Stone Drew B
Current Estimated Value
Home Financials for this Owner
Home Financials are based on the most recent Mortgage that was taken out on this home.
Original Mortgage
$316,500
Outstanding Balance
$280,651
Interest Rate
3.1%
Mortgage Type
New Conventional
Estimated Equity
$485,096
Purchase Details
Closed on
Nov 27, 2002
Sold by
Stone Drew
Bought by
Stone Drew
Purchase Details
Closed on
Nov 19, 1996
Sold by
Enochs + Fred D and Jennifer L Enochs +
Bought by
Norosky Kyle S and Norosky Lesley S
Home Financials for this Owner
Home Financials are based on the most recent Mortgage that was taken out on this home.
Original Mortgage
$160,000
Interest Rate
7.99%
Mortgage Type
New Conventional
Create a Home Valuation Report for This Property
The Home Valuation Report is an in-depth analysis detailing your home's value as well as a comparison with similar homes in the area
Home Values in the Area
Average Home Value in this Area
Purchase History
| Date | Buyer | Sale Price | Title Company |
|---|---|---|---|
| Stone Drew B | -- | Accommodation | |
| Stone Drew | -- | -- | |
| Norosky Kyle S | -- | -- |
Source: Public Records
Mortgage History
| Date | Status | Borrower | Loan Amount |
|---|---|---|---|
| Open | Stone Drew B | $316,500 | |
| Previous Owner | Norosky Kyle S | $160,000 |
Source: Public Records
Tax History Compared to Growth
Tax History
| Year | Tax Paid | Tax Assessment Tax Assessment Total Assessment is a certain percentage of the fair market value that is determined by local assessors to be the total taxable value of land and additions on the property. | Land | Improvement |
|---|---|---|---|---|
| 2025 | $7,767 | $736,890 | $312,000 | $424,890 |
| 2024 | $7,767 | $670,420 | $277,000 | $393,420 |
| 2023 | $7,318 | $648,450 | $277,000 | $371,450 |
| 2022 | $7,060 | $617,440 | $272,000 | $345,440 |
| 2021 | $6,490 | $553,060 | $242,000 | $311,060 |
| 2020 | $6,278 | $530,450 | $237,000 | $293,450 |
| 2019 | $6,050 | $511,160 | $229,000 | $282,160 |
| 2018 | $5,660 | $492,160 | $210,000 | $282,160 |
| 2017 | $5,551 | $478,160 | $196,000 | $282,160 |
| 2016 | $5,539 | $478,160 | $196,000 | $282,160 |
| 2015 | $5,230 | $468,630 | $192,000 | $276,630 |
| 2014 | $4,943 | $443,910 | $182,000 | $261,910 |
Source: Public Records
Map
Nearby Homes
- 8909 Victoria Rd
- 5511 Callander Dr
- 9009 Digory Ct
- 9104 Parliament Dr
- 5639 Fort Corloran Dr
- 5613 Mount Burnside Way
- 0 Lower Cranberry Lake Unit 1624408
- 8616 Canterbury Dr
- 8405 Thames St
- 9001 Fox Lair Dr
- 5801 Boothe Dr
- 8504 Canterbury Dr
- 8441 Thames St
- 8449 Thames St
- 5809 Shana Place
- 5823 Royal Ridge Dr Unit S
- 5608 Doolittle St
- 5835 Fitzhugh St
- 5009 King David Blvd
- 5809 Royal Ridge Dr Unit I
- 8921 Cromwell Dr
- 8925 Cromwell Dr
- 5306 Kings Park Dr
- 8805 Parliament Dr
- 5308 Kings Park Dr
- 8919 Cromwell Dr
- 8927 Cromwell Dr
- 5302 Kings Park Dr
- 8803 Parliament Dr
- 5310 Kings Park Dr
- 8926 Cromwell Dr
- 8928 Cromwell Dr
- 8924 Cromwell Dr
- 5400 Kings Park Dr
- 8809 Parliament Dr
- 5300 Kings Park Dr
- 8727 Piccadilly Place
- 5402 Kings Park Dr
- 8937 Victoria Rd
- 5303 Kings Park Dr