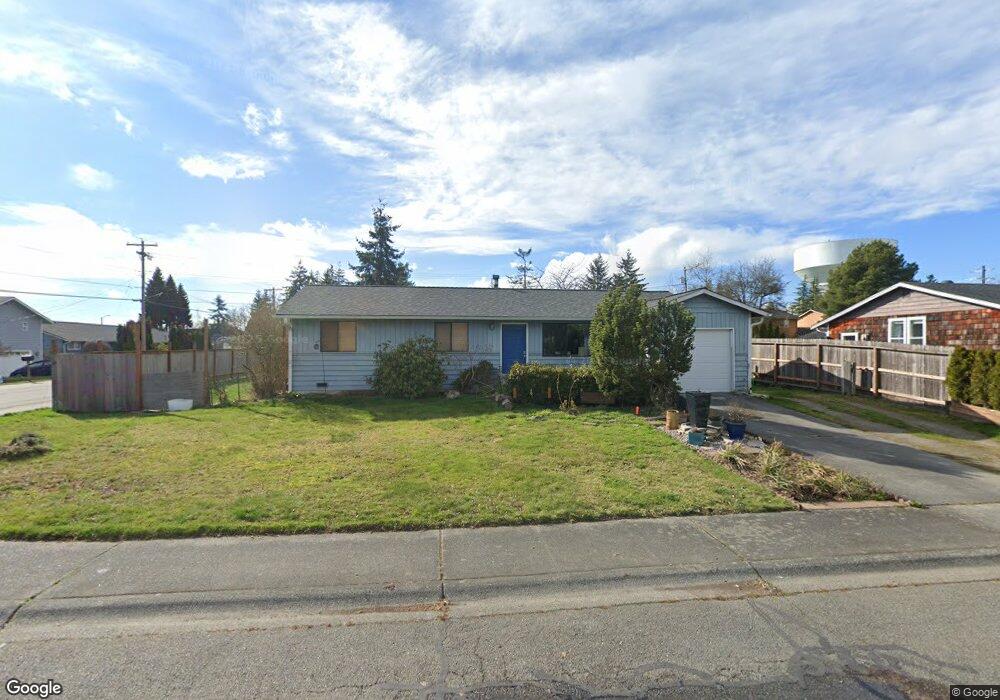
8924 9th Place W Everett, WA 98204
Westmont NeighborhoodEstimated Value: $582,000 - $629,000
3
Beds
2
Baths
1,132
Sq Ft
$537/Sq Ft
Est. Value
About This Home
This home is located at 8924 9th Place W, Everett, WA 98204 and is currently estimated at $607,792, approximately $536 per square foot. 8924 9th Place W is a home located in Snohomish County with nearby schools including Challenger Elementary School, Explorer Middle School, and Mariner High School.
Ownership History
Date
Name
Owned For
Owner Type
Purchase Details
Closed on
Dec 17, 2002
Sold by
Hud
Bought by
Towner Michael J and Towner Dana L
Current Estimated Value
Home Financials for this Owner
Home Financials are based on the most recent Mortgage that was taken out on this home.
Original Mortgage
$163,668
Outstanding Balance
$68,885
Interest Rate
5.96%
Mortgage Type
FHA
Estimated Equity
$538,907
Purchase Details
Closed on
Oct 18, 2002
Sold by
Wells Fargo Home Mtg Inc
Bought by
Hud
Home Financials for this Owner
Home Financials are based on the most recent Mortgage that was taken out on this home.
Original Mortgage
$163,668
Outstanding Balance
$68,885
Interest Rate
5.96%
Mortgage Type
FHA
Estimated Equity
$538,907
Purchase Details
Closed on
Aug 13, 2002
Sold by
Carson Randy
Bought by
Norwest Mtg Inc
Purchase Details
Closed on
Oct 20, 1999
Sold by
Wright Jack E and Wright Rosalie J
Bought by
Carson Randy
Home Financials for this Owner
Home Financials are based on the most recent Mortgage that was taken out on this home.
Original Mortgage
$161,617
Interest Rate
7.82%
Mortgage Type
FHA
Create a Home Valuation Report for This Property
The Home Valuation Report is an in-depth analysis detailing your home's value as well as a comparison with similar homes in the area
Home Values in the Area
Average Home Value in this Area
Purchase History
| Date | Buyer | Sale Price | Title Company |
|---|---|---|---|
| Towner Michael J | $28,089 | First American Title Ins Co | |
| Hud | -- | First American | |
| Norwest Mtg Inc | $175,581 | First American | |
| Carson Randy | $162,950 | -- |
Source: Public Records
Mortgage History
| Date | Status | Borrower | Loan Amount |
|---|---|---|---|
| Open | Towner Michael J | $163,668 | |
| Previous Owner | Carson Randy | $161,617 |
Source: Public Records
Tax History
| Year | Tax Paid | Tax Assessment Tax Assessment Total Assessment is a certain percentage of the fair market value that is determined by local assessors to be the total taxable value of land and additions on the property. | Land | Improvement |
|---|---|---|---|---|
| 2025 | $3,820 | $542,000 | $396,000 | $146,000 |
| 2024 | $3,820 | $481,000 | $335,000 | $146,000 |
| 2023 | $3,514 | $453,600 | $356,000 | $97,600 |
| 2022 | $3,192 | $356,700 | $274,000 | $82,700 |
| 2020 | $2,690 | $301,500 | $223,000 | $78,500 |
| 2019 | $2,358 | $267,000 | $190,000 | $77,000 |
| 2018 | $2,482 | $242,600 | $174,000 | $68,600 |
| 2017 | $2,132 | $212,500 | $150,000 | $62,500 |
| 2016 | $1,958 | $193,000 | $133,000 | $60,000 |
Source: Public Records
Map
Nearby Homes
- 630 90th St SW Unit A/B
- 709 93rd St SW
- 1430 W Casino Rd Unit 63
- 1430 W Casino Rd Unit 272
- 1001 W Casino Rd Unit C201
- 1001 W Casino Rd Unit A303
- 226 93rd Place SW Unit 8
- 1626 93rd Place SW Unit 25
- 9330 16th Dr W Unit 22
- 1427 100th St SW Unit 75
- 1427 100th St SW Unit 160
- 1427 100th St SW Unit 39
- 1427 100th St SW Unit 57
- 1427 100th St SW Unit 27
- 1427 100th St SW Unit 145
- 1427 100th St SW Unit 166
- 1427 100th St SW Unit 154
- 1427 100th St SW Unit 127
- 1427 100th St SW Unit 67
- 9815 Holly Dr Unit A103
- 8918 9th Place W
- 1009-1021 90th St SW
- 920 90th St SW
- 8912 9th Place W
- 8921 9th Place W
- 1006 90th St SW
- 1017 90th St SW Unit B
- 1017 90th St SW Unit A
- 1011 90th St SW Unit B
- 1011 90th St SW Unit A
- 1021 90th St SW Unit B
- 1021 90th St SW Unit A
- 1015 90th St SW Unit B
- 1015 90th St SW Unit A
- 1013 90th St SW Unit C
- 1013 90th St SW Unit B
- 1013 90th St SW Unit A
- 1009 90th St SW Unit D
- 1009 90th St SW Unit C
- 1009 90th St SW Unit B
Your Personal Tour Guide
Ask me questions while you tour the home.