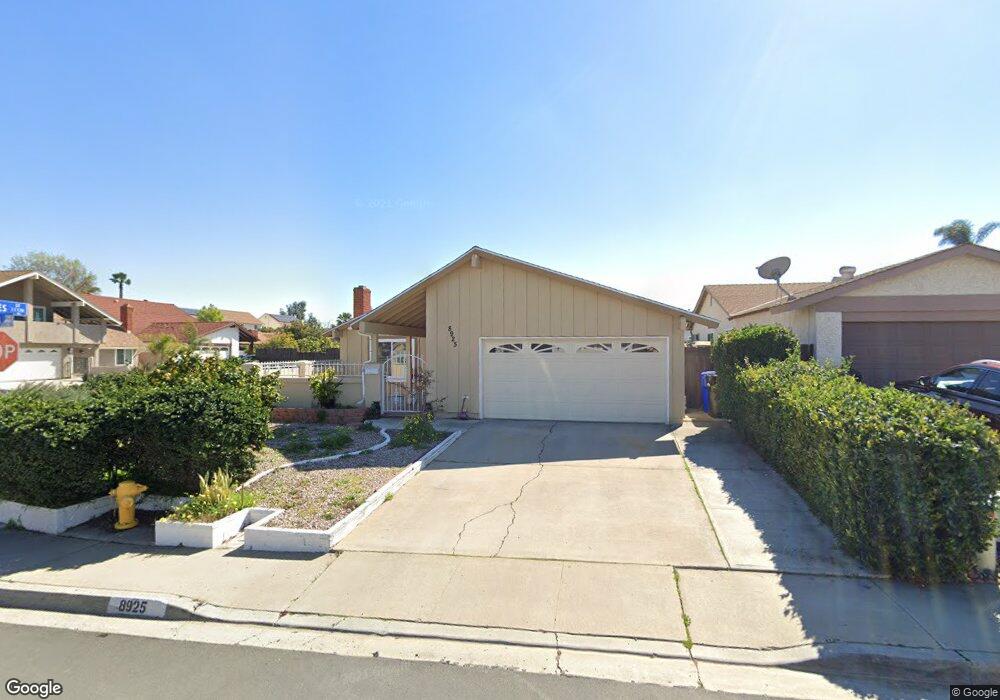
8925 Alphecca Way Unit 11 San Diego, CA 92126
Mira Mesa NeighborhoodEstimated Value: $1,066,000 - $1,100,000
4
Beds
2
Baths
1,614
Sq Ft
$670/Sq Ft
Est. Value
About This Home
This home is located at 8925 Alphecca Way Unit 11, San Diego, CA 92126 and is currently estimated at $1,082,088, approximately $670 per square foot. 8925 Alphecca Way Unit 11 is a home located in San Diego County with nearby schools including Ericson Elementary School, Wangenheim Middle School, and Mira Mesa High School.
Ownership History
Date
Name
Owned For
Owner Type
Purchase Details
Closed on
Apr 6, 2015
Sold by
Truong Huy Q and Ly Ai M
Bought by
The Huy Q Truong & Ai M Ly Trust and Ly Al M
Current Estimated Value
Purchase Details
Closed on
Mar 3, 2004
Sold by
Nguyen Hanh Huu and Nguyen Bi Thi
Bought by
Truong Huy Quoc and Ly Ai My
Home Financials for this Owner
Home Financials are based on the most recent Mortgage that was taken out on this home.
Original Mortgage
$333,000
Outstanding Balance
$154,539
Interest Rate
5.57%
Mortgage Type
Purchase Money Mortgage
Estimated Equity
$927,549
Purchase Details
Closed on
Oct 8, 1998
Sold by
Huu Nguyen Hanh and Thi Bi
Bought by
Nguyen Hanh Huu and Nguyen Bi Thi
Home Financials for this Owner
Home Financials are based on the most recent Mortgage that was taken out on this home.
Original Mortgage
$90,000
Interest Rate
6.79%
Purchase Details
Closed on
Jun 30, 1998
Sold by
Huu Nguyen Hanh and Thi Bi
Bought by
Nguyen Hanh Huu and Nguyen Bi Thi
Purchase Details
Closed on
May 6, 1988
Create a Home Valuation Report for This Property
The Home Valuation Report is an in-depth analysis detailing your home's value as well as a comparison with similar homes in the area
Home Values in the Area
Average Home Value in this Area
Purchase History
| Date | Buyer | Sale Price | Title Company |
|---|---|---|---|
| The Huy Q Truong & Ai M Ly Trust | -- | None Available | |
| Truong Huy Q | -- | None Available | |
| Truong Huy Quoc | $475,000 | Gateway Title Company | |
| Nguyen Hanh Huu | -- | Old Republic Title Company | |
| Nguyen Hanh Huu | -- | Old Republic Title Company | |
| Nguyen Hanh Huu | -- | -- | |
| -- | $147,000 | -- |
Source: Public Records
Mortgage History
| Date | Status | Borrower | Loan Amount |
|---|---|---|---|
| Open | Truong Huy Quoc | $333,000 | |
| Previous Owner | Nguyen Hanh Huu | $90,000 | |
| Closed | Truong Huy Quoc | $47,000 |
Source: Public Records
Tax History Compared to Growth
Tax History
| Year | Tax Paid | Tax Assessment Tax Assessment Total Assessment is a certain percentage of the fair market value that is determined by local assessors to be the total taxable value of land and additions on the property. | Land | Improvement |
|---|---|---|---|---|
| 2025 | $8,184 | $675,321 | $462,063 | $213,258 |
| 2024 | $8,184 | $662,080 | $453,003 | $209,077 |
| 2023 | $8,003 | $649,099 | $444,121 | $204,978 |
| 2022 | $7,789 | $636,372 | $435,413 | $200,959 |
| 2021 | $7,735 | $623,895 | $426,876 | $197,019 |
| 2020 | $7,642 | $617,498 | $422,499 | $194,999 |
| 2019 | $7,505 | $605,391 | $414,215 | $191,176 |
| 2018 | $7,018 | $593,522 | $406,094 | $187,428 |
| 2017 | $6,475 | $550,000 | $374,000 | $176,000 |
| 2016 | $6,146 | $520,000 | $354,000 | $166,000 |
| 2015 | $5,736 | $485,000 | $331,000 | $154,000 |
| 2014 | $4,756 | $400,000 | $273,000 | $127,000 |
Source: Public Records
Map
Nearby Homes
- 11336 Camarosa Cir
- 8943 Calliandra Rd
- 8574 Summerdale Rd Unit 148
- 11368 Squamish Rd
- 9068 Kirby Ct
- 8595 Summerdale Rd Unit 170
- 11034 Sagittarius Rd
- 8468 Calle Morelos
- 11394 Pegasus Ave
- 11187 Kelowna Rd Unit 76
- 8667 Cetus Rd
- 10853 Westonhill Dr
- 8509 Summerdale Rd Unit 365
- 8485 Westmore Rd Unit 40
- 11161 Camino Ruiz Unit 44
- 11313 Zapata Ave Unit 6
- 8479 Westmore Rd Unit 55
- 9005 Ticket St
- 11377 Volans St
- 11358 Vela Dr
- 8917 Alphecca Way
- 8986 Taurus Place
- 8915 Alphecca Way
- 8978 Taurus Place
- 11115 Bootes St
- 11107 Bootes St
- 8970 Taurus Place
- 8909 Alphecca Way
- 11089 Bootes St
- 8924 Alphecca Way
- 11123 Bootes St
- 8916 Alphecca Way
- 11085 Bootes St
- 8962 Taurus Place
- 8914 Alphecca Way
- 11133 Bootes St
- 8895 Alphecca Way
- 11081 Bootes St
- 8908 Alphecca Way
- 8954 Taurus Place