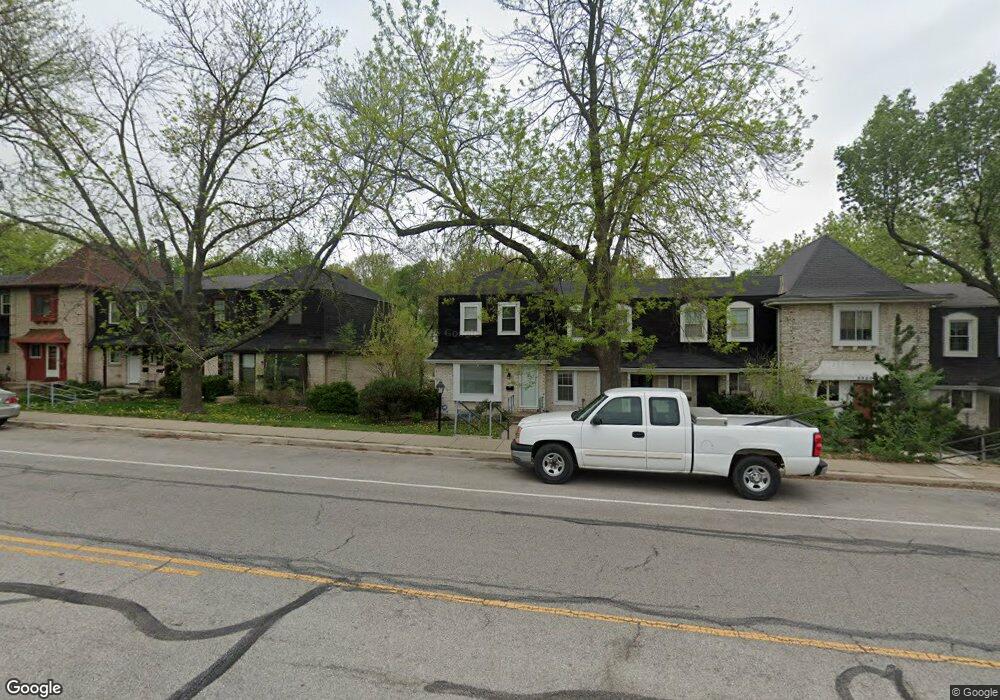
8926 Pflumm Rd Lenexa, KS 66215
Estimated Value: $166,000 - $282,000
2
Beds
2
Baths
1,020
Sq Ft
$215/Sq Ft
Est. Value
About This Home
This home is located at 8926 Pflumm Rd, Lenexa, KS 66215 and is currently estimated at $218,830, approximately $214 per square foot. 8926 Pflumm Rd is a home located in Johnson County with nearby schools including Rising Star Elementary School, Westridge Middle School, and Shawnee Mission West High School.
Ownership History
Date
Name
Owned For
Owner Type
Purchase Details
Closed on
Jun 9, 2021
Sold by
Jh Properties Llc
Bought by
Crupper Jordan and Davies Walker
Current Estimated Value
Home Financials for this Owner
Home Financials are based on the most recent Mortgage that was taken out on this home.
Original Mortgage
$112,100
Outstanding Balance
$100,381
Interest Rate
2.9%
Mortgage Type
New Conventional
Estimated Equity
$118,449
Purchase Details
Closed on
Jun 30, 2017
Sold by
Crupper Scott S and Crupper Datina R
Bought by
Jh Properties Llc
Home Financials for this Owner
Home Financials are based on the most recent Mortgage that was taken out on this home.
Original Mortgage
$37,000
Interest Rate
3.19%
Mortgage Type
New Conventional
Purchase Details
Closed on
May 13, 2016
Sold by
Crupper Scott S and Crupper Tina R
Bought by
Jh Properties Llc
Create a Home Valuation Report for This Property
The Home Valuation Report is an in-depth analysis detailing your home's value as well as a comparison with similar homes in the area
Home Values in the Area
Average Home Value in this Area
Purchase History
| Date | Buyer | Sale Price | Title Company |
|---|---|---|---|
| Crupper Jordan | -- | Continental Title Company | |
| Crupper Jordan | -- | Continental Title Company | |
| Jh Properties Llc | -- | None Available | |
| Crupper Scott S | -- | None Available | |
| Jh Properties Llc | -- | None Available |
Source: Public Records
Mortgage History
| Date | Status | Borrower | Loan Amount |
|---|---|---|---|
| Open | Crupper Jordan | $112,100 | |
| Closed | Crupper Jordan | $112,100 | |
| Previous Owner | Crupper Scott S | $37,000 |
Source: Public Records
Tax History
| Year | Tax Paid | Tax Assessment Tax Assessment Total Assessment is a certain percentage of the fair market value that is determined by local assessors to be the total taxable value of land and additions on the property. | Land | Improvement |
|---|---|---|---|---|
| 2025 | $1,779 | $17,377 | $2,795 | $14,582 |
| 2024 | $1,779 | $16,446 | $2,795 | $13,651 |
| 2023 | $1,685 | $14,893 | $2,151 | $12,742 |
| 2022 | $1,540 | $13,571 | $2,151 | $11,420 |
| 2021 | $1,513 | $12,397 | $1,869 | $10,528 |
| 2020 | $1,667 | $13,582 | $1,869 | $11,713 |
| 2019 | $1,618 | $13,168 | $1,869 | $11,299 |
| 2018 | $1,437 | $11,535 | $1,869 | $9,666 |
| 2017 | $1,308 | $10,132 | $1,495 | $8,637 |
| 2016 | $1,274 | $9,741 | $1,495 | $8,246 |
| 2015 | $1,263 | $9,718 | $1,495 | $8,223 |
| 2013 | -- | $8,660 | $1,495 | $7,165 |
Source: Public Records
Map
Nearby Homes
- 8834 Candlelight Ln
- 8740 Park St
- 13204 W 85th Ct
- 13212 W 84th St
- 9401 Cottonwood St
- 12908 W 84th St
- 8422 Rosehill Rd
- 12525 W 85th Terrace
- 12521 W 85th Terrace
- 8545 Westgate St
- 9412 Mullen Rd
- 8211 Caenen Lake Rd
- 14640 W 90th St
- 14523 Brentwood Dr
- 8221 Noland Rd
- 8362 Oakview Cir
- 14900 W 91st Terrace
- 8914 Country Hill Ct
- 8443 Alden St
- 9212 Constance St
Your Personal Tour Guide
Ask me questions while you tour the home.