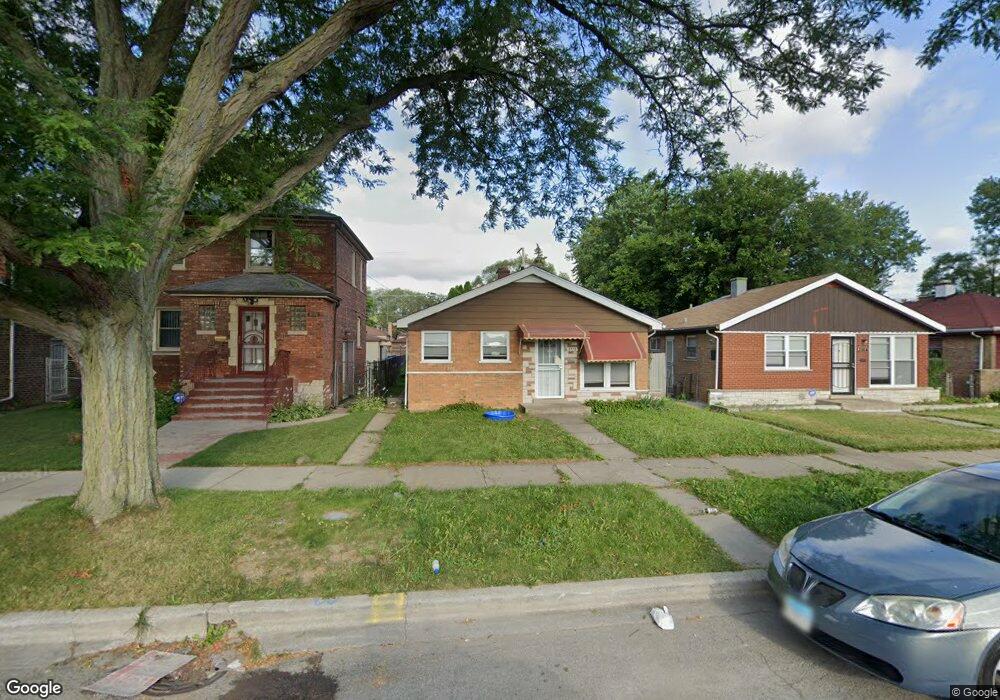
8928 S Carpenter St Chicago, IL 60620
Brainerd NeighborhoodEstimated Value: $149,000 - $325,000
2
Beds
1
Bath
1,040
Sq Ft
$226/Sq Ft
Est. Value
About This Home
This home is located at 8928 S Carpenter St, Chicago, IL 60620 and is currently estimated at $234,631, approximately $225 per square foot. 8928 S Carpenter St is a home located in Cook County with nearby schools including Mahalia Jackson Elementary School, Harlan Community Academy High School, and Hansberry College Prep.
Ownership History
Date
Name
Owned For
Owner Type
Purchase Details
Closed on
Feb 23, 2018
Sold by
Htb Real Estate Investments Inc
Bought by
Taj Real Estate Holdings Inc
Current Estimated Value
Purchase Details
Closed on
May 1, 2011
Sold by
Htb Hardware Inc
Bought by
Htb Real Estate Investments Inc
Purchase Details
Closed on
Feb 23, 2011
Sold by
Deutsche Bank National Trust Company
Bought by
Htb Hardware Inc
Purchase Details
Closed on
Aug 16, 2010
Sold by
Olutunfese
Bought by
Deutsche Bank National Trust Company
Purchase Details
Closed on
Aug 31, 2006
Sold by
Urban Investment Group Llc
Bought by
Olutunfese Yemisi R
Home Financials for this Owner
Home Financials are based on the most recent Mortgage that was taken out on this home.
Original Mortgage
$153,000
Interest Rate
8.95%
Mortgage Type
Unknown
Purchase Details
Closed on
Jan 26, 2005
Sold by
Watts Imogene
Bought by
Urban Investment Group Llc
Home Financials for this Owner
Home Financials are based on the most recent Mortgage that was taken out on this home.
Original Mortgage
$91,600
Interest Rate
7.37%
Mortgage Type
Unknown
Create a Home Valuation Report for This Property
The Home Valuation Report is an in-depth analysis detailing your home's value as well as a comparison with similar homes in the area
Home Values in the Area
Average Home Value in this Area
Purchase History
| Date | Buyer | Sale Price | Title Company |
|---|---|---|---|
| Taj Real Estate Holdings Inc | -- | None Available | |
| Htb Real Estate Investments Inc | $72,000 | Git | |
| Htb Hardware Inc | $33,000 | Cti | |
| Deutsche Bank National Trust Company | -- | None Available | |
| Olutunfese Yemisi R | $170,000 | Ticor Title Insurance Compan | |
| Urban Investment Group Llc | $87,000 | Multiple |
Source: Public Records
Mortgage History
| Date | Status | Borrower | Loan Amount |
|---|---|---|---|
| Previous Owner | Olutunfese Yemisi R | $153,000 | |
| Previous Owner | Urban Investment Group Llc | $91,600 |
Source: Public Records
Tax History
| Year | Tax Paid | Tax Assessment Tax Assessment Total Assessment is a certain percentage of the fair market value that is determined by local assessors to be the total taxable value of land and additions on the property. | Land | Improvement |
|---|---|---|---|---|
| 2025 | $3,172 | $14,000 | $4,156 | $9,844 |
| 2024 | $3,172 | $14,000 | $4,156 | $9,844 |
| 2023 | $3,094 | $15,000 | $3,281 | $11,719 |
| 2022 | $3,094 | $15,000 | $3,281 | $11,719 |
| 2021 | $3,025 | $14,999 | $3,281 | $11,718 |
| 2020 | $1,881 | $8,422 | $3,281 | $5,141 |
| 2019 | $1,864 | $9,255 | $3,281 | $5,974 |
| 2018 | $1,833 | $9,255 | $3,281 | $5,974 |
| 2017 | $2,793 | $12,945 | $2,843 | $10,102 |
| 2016 | $2,599 | $12,945 | $2,843 | $10,102 |
| 2015 | $2,378 | $12,945 | $2,843 | $10,102 |
| 2014 | $2,285 | $12,283 | $2,625 | $9,658 |
| 2013 | $2,239 | $12,283 | $2,625 | $9,658 |
Source: Public Records
Map
Nearby Homes
- 8953 S Aberdeen St
- 8952 S Aberdeen St
- 8942 S Aberdeen St
- 9020 S Carpenter St
- 8948 S Vincennes Ave
- 8845 S Carpenter St
- 8917 S Elizabeth St
- 8802 S Carpenter St
- 9133 S Racine Ave
- 8810 S Racine Ave
- 8817 S Elizabeth St
- 1146 W 88th St
- 8837 S Throop St
- 1048 W 92nd Place
- 1040 W 92nd Place
- 8714 S May St
- 8824 S Throop St
- 9115 S Green St
- 8745 S Throop St
- 8731 S Throop St
- 8930 S Carpenter St
- 8924 S Carpenter St
- 8934 S Carpenter St
- 8920 S Carpenter St
- 8918 S Carpenter St
- 8918 S Carpenter St
- 8936 S Carpenter St
- 8940 S Carpenter St
- 8914 S Carpenter St
- 8927 S Aberdeen St
- 8929 S Aberdeen St
- 8923 S Aberdeen St
- 8935 S Aberdeen St
- 8919 S Aberdeen St
- 8942 S Carpenter St
- 8931 S Aberdeen St
- 8910 S Carpenter St
- 8939 S Aberdeen St
- 8915 S Aberdeen St
- 8929 S Carpenter St
Your Personal Tour Guide
Ask me questions while you tour the home.