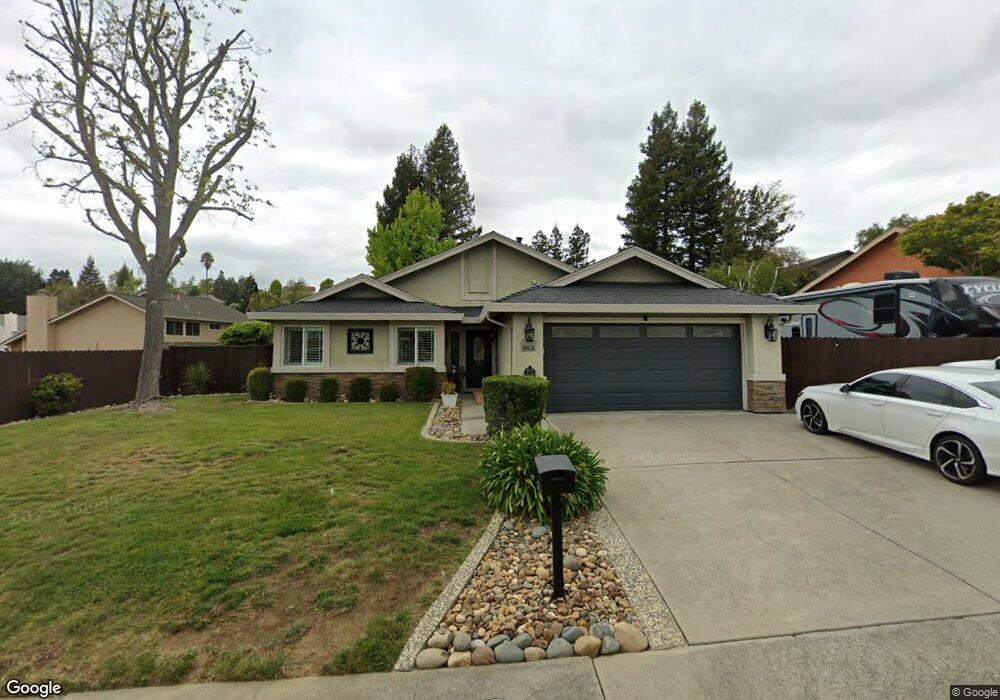
893 Hanlon Way Benicia, CA 94510
Estimated Value: $874,000 - $953,000
3
Beds
2
Baths
1,859
Sq Ft
$488/Sq Ft
Est. Value
About This Home
This home is located at 893 Hanlon Way, Benicia, CA 94510 and is currently estimated at $906,298, approximately $487 per square foot. 893 Hanlon Way is a home located in Solano County with nearby schools including Matthew Turner Elementary School, Benicia Middle School, and Benicia High School.
Ownership History
Date
Name
Owned For
Owner Type
Purchase Details
Closed on
Aug 15, 2003
Sold by
Long Rebecca L
Bought by
Brink Jason and Brink Julie
Current Estimated Value
Home Financials for this Owner
Home Financials are based on the most recent Mortgage that was taken out on this home.
Original Mortgage
$383,200
Outstanding Balance
$168,500
Interest Rate
5.6%
Mortgage Type
Stand Alone First
Estimated Equity
$737,798
Create a Home Valuation Report for This Property
The Home Valuation Report is an in-depth analysis detailing your home's value as well as a comparison with similar homes in the area
Home Values in the Area
Average Home Value in this Area
Purchase History
| Date | Buyer | Sale Price | Title Company |
|---|---|---|---|
| Brink Jason | $479,000 | North American Title Co |
Source: Public Records
Mortgage History
| Date | Status | Borrower | Loan Amount |
|---|---|---|---|
| Open | Brink Jason | $383,200 |
Source: Public Records
Tax History Compared to Growth
Tax History
| Year | Tax Paid | Tax Assessment Tax Assessment Total Assessment is a certain percentage of the fair market value that is determined by local assessors to be the total taxable value of land and additions on the property. | Land | Improvement |
|---|---|---|---|---|
| 2025 | $7,899 | $681,026 | $142,173 | $538,853 |
| 2024 | $7,899 | $698,399 | $139,386 | $559,013 |
| 2023 | $7,707 | $654,583 | $136,653 | $517,930 |
| 2022 | $7,562 | $641,749 | $133,974 | $507,775 |
| 2021 | $7,407 | $629,167 | $131,348 | $497,819 |
| 2020 | $7,307 | $622,717 | $130,002 | $492,715 |
| 2019 | $7,179 | $610,507 | $127,453 | $483,054 |
| 2018 | $6,994 | $598,537 | $124,954 | $473,583 |
| 2017 | $6,739 | $579,000 | $86,000 | $493,000 |
| 2016 | $6,668 | $557,000 | $89,000 | $468,000 |
| 2015 | $6,202 | $524,000 | $89,000 | $435,000 |
| 2014 | $5,696 | $478,000 | $86,000 | $392,000 |
Source: Public Records
Map
Nearby Homes
- 882 Oxford Way
- 837 Clifton Ct
- 877 Rose Dr
- 780 Rose Dr
- 633 Belvedere Dr
- 772 Barton Way
- 8628 Rockaway Dr
- 8842 Blue River Dr
- 8707 Aquamarine Dr
- 8649 Rockaway Dr
- 8621 Rockaway Dr
- 414 Brunswick Dr
- 187 Fleet St
- 8094 Waterfall Ln
- 8078 Waterfall Ln
- 178 Fleet St
- 433 Brunswick Dr
- 921 Bolton Cir
- 8091 Waterfall Ln
- 128 Newcastle Dr