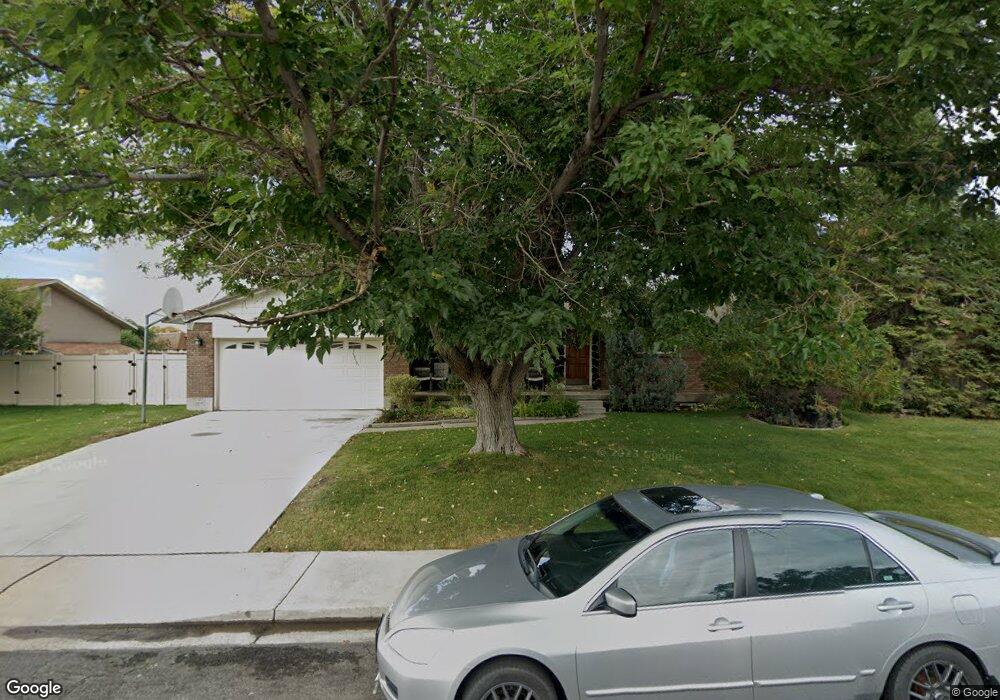
893 N 750 E Orem, UT 84097
Old Orchard NeighborhoodEstimated Value: $556,000 - $647,000
4
Beds
3
Baths
2,828
Sq Ft
$206/Sq Ft
Est. Value
About This Home
This home is located at 893 N 750 E, Orem, UT 84097 and is currently estimated at $583,357, approximately $206 per square foot. 893 N 750 E is a home located in Utah County with nearby schools including Orchard Elementary School, Canyon View Junior High School, and Orem High School.
Ownership History
Date
Name
Owned For
Owner Type
Purchase Details
Closed on
Dec 16, 2002
Sold by
Carroll Dionisio J
Bought by
Carroll Dionisio J and Carroll Lilian
Current Estimated Value
Home Financials for this Owner
Home Financials are based on the most recent Mortgage that was taken out on this home.
Original Mortgage
$140,300
Interest Rate
6.03%
Purchase Details
Closed on
Mar 4, 1998
Sold by
Carroll Dionisio and Carroll Lilian
Bought by
Carroll Dionisio J and Carroll Lilian
Purchase Details
Closed on
Apr 1, 1997
Sold by
Brown Jerry Vernal
Bought by
Brown Radawn H
Home Financials for this Owner
Home Financials are based on the most recent Mortgage that was taken out on this home.
Original Mortgage
$141,075
Interest Rate
7.56%
Purchase Details
Closed on
Mar 31, 1997
Sold by
Brown Radawn H
Bought by
Carroll Dionisio and Carroll Lilian
Home Financials for this Owner
Home Financials are based on the most recent Mortgage that was taken out on this home.
Original Mortgage
$141,075
Interest Rate
7.56%
Create a Home Valuation Report for This Property
The Home Valuation Report is an in-depth analysis detailing your home's value as well as a comparison with similar homes in the area
Home Values in the Area
Average Home Value in this Area
Purchase History
| Date | Buyer | Sale Price | Title Company |
|---|---|---|---|
| Carroll Dionisio J | -- | -- | |
| Carroll Dionisio J | -- | Backman Stewart Title Servi | |
| Carroll Dionisio J | -- | -- | |
| Brown Radawn H | -- | -- | |
| Carroll Dionisio | -- | -- |
Source: Public Records
Mortgage History
| Date | Status | Borrower | Loan Amount |
|---|---|---|---|
| Closed | Carroll Dionisio J | $140,300 | |
| Previous Owner | Carroll Dionisio | $141,075 |
Source: Public Records
Tax History
| Year | Tax Paid | Tax Assessment Tax Assessment Total Assessment is a certain percentage of the fair market value that is determined by local assessors to be the total taxable value of land and additions on the property. | Land | Improvement |
|---|---|---|---|---|
| 2025 | $2,356 | $304,425 | -- | -- |
| 2024 | $2,356 | $288,145 | $0 | $0 |
| 2023 | $2,186 | $287,265 | $0 | $0 |
| 2022 | $2,161 | $275,165 | $0 | $0 |
| 2021 | $1,846 | $356,000 | $141,900 | $214,100 |
| 2020 | $1,706 | $323,400 | $113,500 | $209,900 |
| 2019 | $1,536 | $302,800 | $102,900 | $199,900 |
| 2018 | $1,472 | $277,200 | $99,300 | $177,900 |
| 2017 | $1,438 | $145,035 | $0 | $0 |
| 2016 | $1,415 | $131,670 | $0 | $0 |
| 2015 | $1,394 | $122,650 | $0 | $0 |
| 2014 | -- | $115,335 | $0 | $0 |
Source: Public Records
Map
Nearby Homes
- 976 N 560 E
- 471 E 700 N
- 710 E 1280 N
- 551 N 900 E
- 362 E 800 N Unit 1
- 1324 N 750 E Unit 3
- 372 E 1165 N
- 733 E 1450 N Unit 5
- 1356 N 750 E Unit 11
- 453 N 650 E
- 713 E 1450 N Unit 23
- 1366 N 750 E
- 747 E 1500 N Unit 13
- 713 E 1500 St N Unit 19
- 723 E 1450 N Unit 25
- 789 200 E Unit 787
- 337 Birchwood Dr
- 917 N Garden Dr
- 307 E Elmwood Dr
- 305 E Elmwood Dr
Your Personal Tour Guide
Ask me questions while you tour the home.