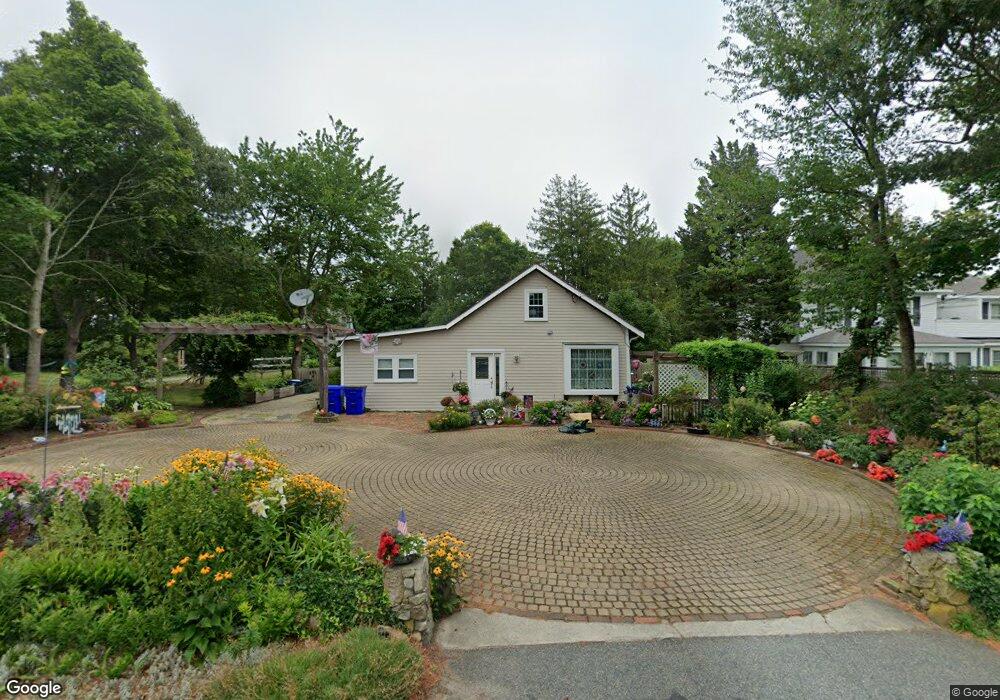
893 Shore Rd Pocasset, MA 02559
Pocasset NeighborhoodEstimated Value: $457,000 - $791,000
2
Beds
2
Baths
1,531
Sq Ft
$409/Sq Ft
Est. Value
About This Home
This home is located at 893 Shore Rd, Pocasset, MA 02559 and is currently estimated at $626,912, approximately $409 per square foot. 893 Shore Rd is a home located in Barnstable County with nearby schools including Bourne High School and Cadence Academy Preschool - Bourne.
Ownership History
Date
Name
Owned For
Owner Type
Purchase Details
Closed on
Apr 12, 2004
Sold by
Denmark-Bryant Priscilla
Bought by
Bryant John and Bryant Priscilla D
Current Estimated Value
Home Financials for this Owner
Home Financials are based on the most recent Mortgage that was taken out on this home.
Original Mortgage
$190,000
Outstanding Balance
$87,684
Interest Rate
5.6%
Mortgage Type
Purchase Money Mortgage
Estimated Equity
$539,228
Purchase Details
Closed on
Jun 19, 1992
Sold by
Bryant John L and Bryant Charray J
Bought by
Denmark Priscilla J
Home Financials for this Owner
Home Financials are based on the most recent Mortgage that was taken out on this home.
Original Mortgage
$64,000
Interest Rate
8.67%
Mortgage Type
Purchase Money Mortgage
Create a Home Valuation Report for This Property
The Home Valuation Report is an in-depth analysis detailing your home's value as well as a comparison with similar homes in the area
Home Values in the Area
Average Home Value in this Area
Purchase History
| Date | Buyer | Sale Price | Title Company |
|---|---|---|---|
| Bryant John | -- | -- | |
| Bryant John | -- | -- | |
| Denmark Priscilla J | $80,000 | -- | |
| Denmark Priscilla J | $80,000 | -- |
Source: Public Records
Mortgage History
| Date | Status | Borrower | Loan Amount |
|---|---|---|---|
| Open | Bryant John | $190,000 | |
| Closed | Denmark Priscilla J | $190,000 | |
| Previous Owner | Denmark Priscilla J | $64,000 |
Source: Public Records
Tax History Compared to Growth
Tax History
| Year | Tax Paid | Tax Assessment Tax Assessment Total Assessment is a certain percentage of the fair market value that is determined by local assessors to be the total taxable value of land and additions on the property. | Land | Improvement |
|---|---|---|---|---|
| 2025 | $3,325 | $425,700 | $186,000 | $239,700 |
| 2024 | $3,323 | $414,300 | $186,000 | $228,300 |
| 2023 | $3,231 | $366,700 | $164,600 | $202,100 |
| 2022 | $3,089 | $306,100 | $145,600 | $160,500 |
| 2021 | $3,002 | $278,700 | $132,500 | $146,200 |
| 2020 | $2,990 | $278,400 | $131,300 | $147,100 |
| 2019 | $2,839 | $270,100 | $131,300 | $138,800 |
| 2018 | $2,753 | $261,200 | $125,100 | $136,100 |
| 2017 | $2,665 | $258,700 | $123,900 | $134,800 |
| 2016 | $2,503 | $246,400 | $118,000 | $128,400 |
| 2015 | $2,481 | $246,400 | $118,000 | $128,400 |
Source: Public Records
Map
Nearby Homes