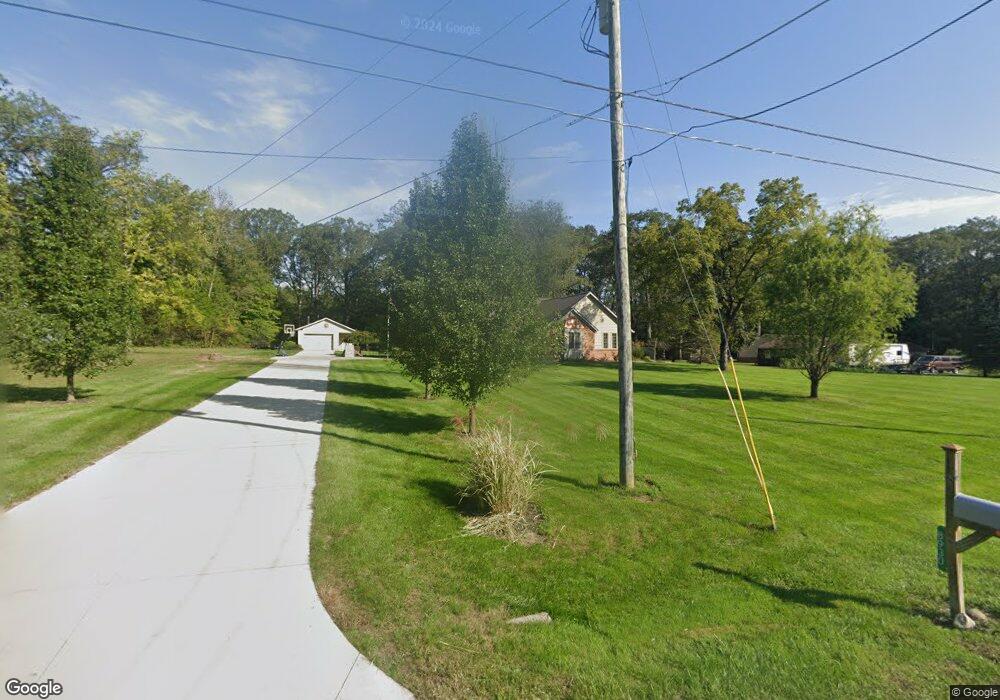
8930 Bice Rd Spencerville, OH 45887
Estimated Value: $247,000 - $345,000
3
Beds
2
Baths
1,610
Sq Ft
$175/Sq Ft
Est. Value
About This Home
This home is located at 8930 Bice Rd, Spencerville, OH 45887 and is currently estimated at $281,523, approximately $174 per square foot. 8930 Bice Rd is a home located in Allen County with nearby schools including Spencerville Elementary School, Spencerville Middle School, and Spencerville High School.
Ownership History
Date
Name
Owned For
Owner Type
Purchase Details
Closed on
Jan 26, 2021
Sold by
Howard Tod A and Howard Michelle A
Bought by
Howard Tod A and Howard Michelle A
Current Estimated Value
Purchase Details
Closed on
Nov 6, 2015
Sold by
Scott Kenneth H
Bought by
Lee Michelle A and Howard Tod A
Home Financials for this Owner
Home Financials are based on the most recent Mortgage that was taken out on this home.
Original Mortgage
$122,400
Outstanding Balance
$96,534
Interest Rate
3.87%
Mortgage Type
Purchase Money Mortgage
Estimated Equity
$184,989
Purchase Details
Closed on
Jun 21, 2005
Sold by
Scott Kenneth H and Scott Shan
Bought by
Scott Kenneth H and Scott Shan
Purchase Details
Closed on
Sep 24, 1992
Bought by
Scott Kenneth H
Create a Home Valuation Report for This Property
The Home Valuation Report is an in-depth analysis detailing your home's value as well as a comparison with similar homes in the area
Purchase History
| Date | Buyer | Sale Price | Title Company |
|---|---|---|---|
| Howard Tod A | -- | None Available | |
| Lee Michelle A | $153,000 | None Available | |
| Scott Kenneth H | -- | None Available | |
| Scott Kenneth H | $146,500 | -- |
Source: Public Records
Mortgage History
| Date | Status | Borrower | Loan Amount |
|---|---|---|---|
| Open | Lee Michelle A | $122,400 |
Source: Public Records
Tax History
| Year | Tax Paid | Tax Assessment Tax Assessment Total Assessment is a certain percentage of the fair market value that is determined by local assessors to be the total taxable value of land and additions on the property. | Land | Improvement |
|---|---|---|---|---|
| 2024 | $2,548 | $82,330 | $15,160 | $67,170 |
| 2023 | $2,091 | $63,320 | $11,660 | $51,660 |
| 2022 | $2,197 | $63,320 | $11,660 | $51,660 |
| 2021 | $2,191 | $63,320 | $11,660 | $51,660 |
| 2020 | $2,050 | $57,120 | $11,340 | $45,780 |
| 2019 | $2,050 | $57,120 | $11,340 | $45,780 |
| 2018 | $1,977 | $57,120 | $11,340 | $45,780 |
| 2017 | $1,891 | $52,960 | $11,340 | $41,620 |
| 2016 | $1,840 | $52,960 | $11,340 | $41,620 |
| 2015 | $1,649 | $52,960 | $11,340 | $41,620 |
| 2014 | $1,649 | $55,650 | $10,780 | $44,870 |
| 2013 | $1,660 | $55,650 | $10,780 | $44,870 |
Source: Public Records
Map
Nearby Homes
- 3000 S Sunderland Rd
- 3000 Sunderland Rd
- 8240 Spencerville Rd
- 7630 Spencerville Rd
- 7570 Fort Amanda Rd
- 17683 Ohio 117
- 22284 Ohio 198
- 0 Agerter Rd
- 2340 S Wapak Rd
- 00 National Rd
- 714 Briggs Ave Unit 1
- 313 S Broadway St
- 305 N Broadway St
- 4906 Shoshone Trail
- 845 Atalan Trail
- 408 N Mulberry St
- 510 S Broadway St
- 4875 Wenatchi Trail
- 522 S Broadway St
- 2905 Oak Hill Ct
Your Personal Tour Guide
Ask me questions while you tour the home.