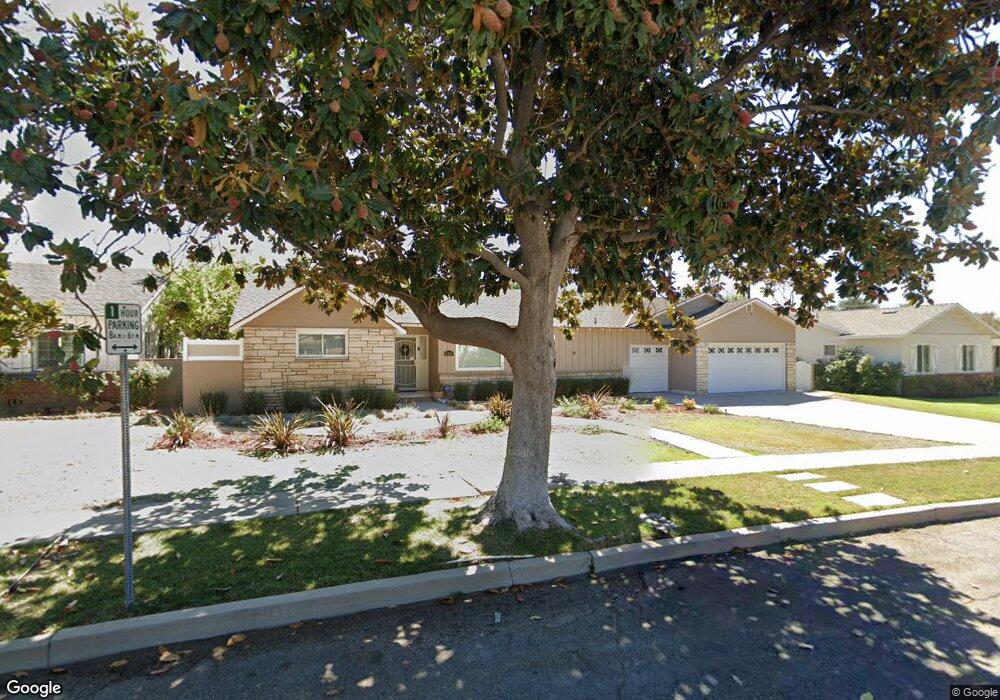
8930 Nestle Ave Northridge, CA 91325
Estimated Value: $1,093,000 - $1,226,000
3
Beds
3
Baths
1,940
Sq Ft
$603/Sq Ft
Est. Value
About This Home
This home is located at 8930 Nestle Ave, Northridge, CA 91325 and is currently estimated at $1,169,884, approximately $603 per square foot. 8930 Nestle Ave is a home located in Los Angeles County with nearby schools including Northridge Middle School, Northridge Academy High, and Valley Academy of Arts & Sciences.
Ownership History
Date
Name
Owned For
Owner Type
Purchase Details
Closed on
Jul 15, 2020
Sold by
Willey Temma M and Willey Glenn
Bought by
Willey Glenn and Willey Temma M
Current Estimated Value
Purchase Details
Closed on
Jun 17, 2010
Sold by
Willey Glenn and Willey Temma M
Bought by
Willey Temma M and Willey Glenn
Home Financials for this Owner
Home Financials are based on the most recent Mortgage that was taken out on this home.
Original Mortgage
$413,000
Outstanding Balance
$275,977
Interest Rate
4.91%
Mortgage Type
New Conventional
Estimated Equity
$893,907
Purchase Details
Closed on
Aug 1, 2007
Sold by
Swayze Olga and Swayze Family 1991 Living Trus
Bought by
Willey Glenn and Kramer Temma M
Home Financials for this Owner
Home Financials are based on the most recent Mortgage that was taken out on this home.
Original Mortgage
$417,000
Interest Rate
6.74%
Mortgage Type
Purchase Money Mortgage
Create a Home Valuation Report for This Property
The Home Valuation Report is an in-depth analysis detailing your home's value as well as a comparison with similar homes in the area
Home Values in the Area
Average Home Value in this Area
Purchase History
| Date | Buyer | Sale Price | Title Company |
|---|---|---|---|
| Willey Glenn | -- | None Available | |
| Willey Temma M | -- | Lawyers Title | |
| Willey Glenn | $565,000 | Fidelity National Title Co |
Source: Public Records
Mortgage History
| Date | Status | Borrower | Loan Amount |
|---|---|---|---|
| Open | Willey Temma M | $413,000 | |
| Closed | Willey Glenn | $417,000 |
Source: Public Records
Tax History
| Year | Tax Paid | Tax Assessment Tax Assessment Total Assessment is a certain percentage of the fair market value that is determined by local assessors to be the total taxable value of land and additions on the property. | Land | Improvement |
|---|---|---|---|---|
| 2025 | $10,943 | $900,051 | $565,464 | $334,587 |
| 2024 | $10,943 | $882,404 | $554,377 | $328,027 |
| 2023 | $10,733 | $865,103 | $543,507 | $321,596 |
| 2022 | $10,238 | $848,141 | $532,850 | $315,291 |
| 2021 | $10,105 | $831,511 | $522,402 | $309,109 |
| 2019 | $8,902 | $730,000 | $511,300 | $218,700 |
| 2018 | $8,563 | $701,000 | $491,000 | $210,000 |
| 2016 | $6,707 | $553,000 | $387,000 | $166,000 |
| 2015 | $6,028 | $496,000 | $347,000 | $149,000 |
| 2014 | $5,806 | $466,000 | $326,300 | $139,700 |
Source: Public Records
Map
Nearby Homes
- 8800 Etiwanda Ave Unit 7
- 9027 Lindley Ave
- 8730 Etiwanda Ave
- 17933 Osborne St
- 18350 Napa St
- 9301 Darby Ave
- 18535 Bryant St
- 18251 Chase St
- 17716 Nordhoff St
- 18557 Napa St
- 8523 & 8521 Lindley Ave
- 9757 -9737 White Oak
- 17800 Raymer St
- 17917 Chase St
- 8421 Lindley Ave
- 8400 Chimineas Ave
- 9101 Geyser Ave
- 18649 Chase St
- 18114 Schoenborn St
- 8350 Reseda Blvd
- 8920 Nestle Ave
- 8936 Nestle Ave
- 8933 Garden Grove Ave
- 8935 Garden Grove Ave
- 8931 Garden Grove Ave
- 8912 Nestle Ave
- 8948 Nestle Ave
- 8941 Garden Grove Ave
- 8927 Nestle Ave
- 8933 Nestle Ave
- 8921 Nestle Ave
- 8939 Nestle Ave
- 8929 Garden Grove Ave
- 8947 Garden Grove Ave
- 18219 Rayen St
- 8915 Nestle Ave
- 18215 Rayen St
- 8945 Nestle Ave
- 18233 Rayen St
- 18209 Rayen St
Your Personal Tour Guide
Ask me questions while you tour the home.