8932 Thornton Garden Ln Raleigh, NC 27616
Forestville NeighborhoodEstimated Value: $257,860 - $286,000
3
Beds
3
Baths
1,364
Sq Ft
$194/Sq Ft
Est. Value
About This Home
This home is located at 8932 Thornton Garden Ln, Raleigh, NC 27616 and is currently estimated at $264,965, approximately $194 per square foot. 8932 Thornton Garden Ln is a home located in Wake County with nearby schools including Wildwood Forest Elementary, East Millbrook Middle, and Wakefield High School.
Ownership History
Date
Name
Owned For
Owner Type
Purchase Details
Closed on
Aug 14, 2018
Sold by
Magram Richard O and Chang Qing
Bought by
Dark Star Properties Llc
Current Estimated Value
Purchase Details
Closed on
Jul 1, 2018
Sold by
Villanueva Ailea and Rock Zachary David
Bought by
Magram Richard O
Purchase Details
Closed on
May 17, 2018
Sold by
Bravo Matthew and Bravo Jennifer
Bought by
Villanueva Ailea
Purchase Details
Closed on
Feb 1, 2006
Sold by
Anderson Homes Inc
Bought by
Bravo Matthew and Villanueva Ailea
Home Financials for this Owner
Home Financials are based on the most recent Mortgage that was taken out on this home.
Original Mortgage
$104,112
Interest Rate
5.87%
Mortgage Type
Fannie Mae Freddie Mac
Create a Home Valuation Report for This Property
The Home Valuation Report is an in-depth analysis detailing your home's value as well as a comparison with similar homes in the area
Home Values in the Area
Average Home Value in this Area
Purchase History
| Date | Buyer | Sale Price | Title Company |
|---|---|---|---|
| Dark Star Properties Llc | -- | None Available | |
| Magram Richard O | $158,000 | None Available | |
| Villanueva Ailea | -- | None Available | |
| Bravo Matthew | $130,500 | None Available |
Source: Public Records
Mortgage History
| Date | Status | Borrower | Loan Amount |
|---|---|---|---|
| Previous Owner | Bravo Matthew | $104,112 |
Source: Public Records
Tax History Compared to Growth
Tax History
| Year | Tax Paid | Tax Assessment Tax Assessment Total Assessment is a certain percentage of the fair market value that is determined by local assessors to be the total taxable value of land and additions on the property. | Land | Improvement |
|---|---|---|---|---|
| 2025 | $2,376 | $270,111 | $65,000 | $205,111 |
| 2024 | $2,366 | $270,111 | $65,000 | $205,111 |
| 2023 | $1,779 | $161,361 | $35,000 | $126,361 |
| 2022 | $1,654 | $161,361 | $35,000 | $126,361 |
| 2021 | $1,590 | $161,361 | $35,000 | $126,361 |
| 2020 | $1,561 | $161,361 | $35,000 | $126,361 |
| 2019 | $1,512 | $128,759 | $26,000 | $102,759 |
| 2018 | $0 | $128,759 | $26,000 | $102,759 |
| 2017 | $1,359 | $128,759 | $26,000 | $102,759 |
| 2016 | $1,332 | $128,759 | $26,000 | $102,759 |
| 2015 | $1,335 | $126,987 | $26,000 | $100,987 |
| 2014 | -- | $126,987 | $26,000 | $100,987 |
Source: Public Records
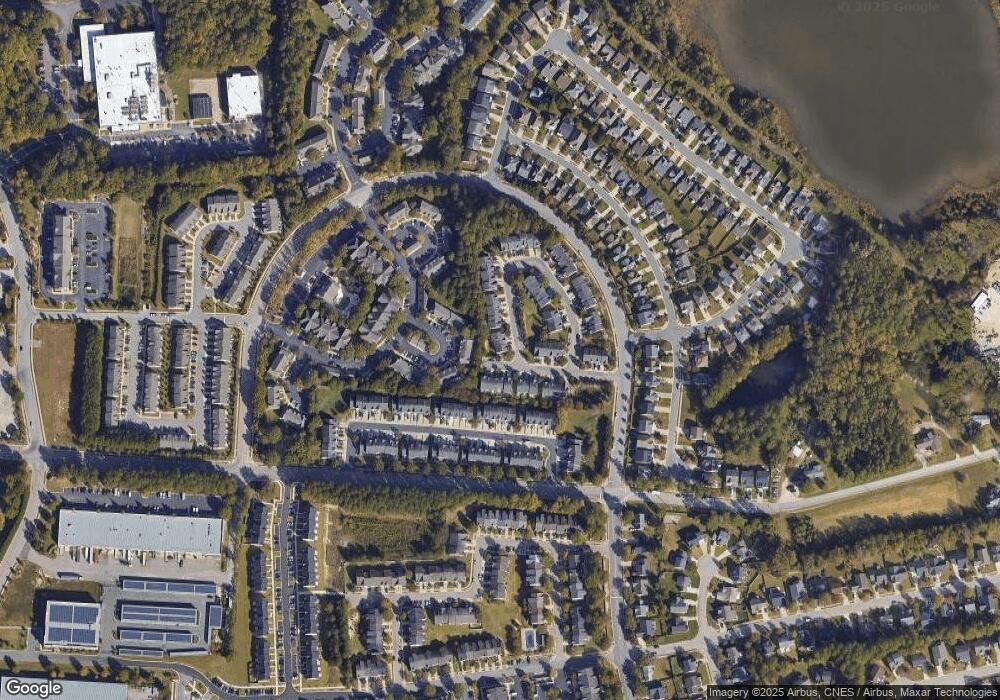
Map
Nearby Homes
- 8857 Thornton Town Place
- 5163 Sandy Banks Rd
- 5107 Sandy Banks Rd
- 8957 Commons Townes Dr
- 5121 Neuse Commons Ln
- 8707 River Keeper Way
- 8620 Neuse Club Ln Unit 107
- 8620 Neuse Club Ln Unit 111
- 8610 Neuse Landing Ln Unit 103
- JONATHAN Plan at Thornton Townes
- SYDNEY Plan at Thornton Townes
- 4821 Gossamer Ln Unit 105
- 4820 Gossamer Ln Unit 101 & 102
- 4820 Gossamer Ln Unit 104
- 8611 Brushfoot Way Unit 107
- 8702 Neuse Town Dr
- 8529 Beckett Chase Way
- 8523 Beckett Chase Way
- 8521 Beckett Chase Way
- 8519 Beckett Chase Way
- 8930 Thornton Garden Ln
- 8928 Thornton Garden Ln
- 8922 Thornton Garden Ln
- 5115 Thornton Knoll Way
- 8920 Thornton Garden Ln
- 5108 Thornton Knoll Way
- 5110 Thornton Knoll Way
- 5106 Thornton Knoll Way
- 5106 Thornton Noll Way
- 5104 Thornton Noll Way
- 5112 Thornton Knoll Way
- 5104 Thornton Knoll Way
- 8918 Thornton Garden Ln
- 5117 Thornton Knoll Way
- 5102 Thornton Knoll Way
- 5114 Thornton Knoll Way
- 8916 Thornton Garden Ln
- 5116 Thornton Knoll Way
- 5119 Thornton Noll Way
- 5119 Thornton Knoll Way