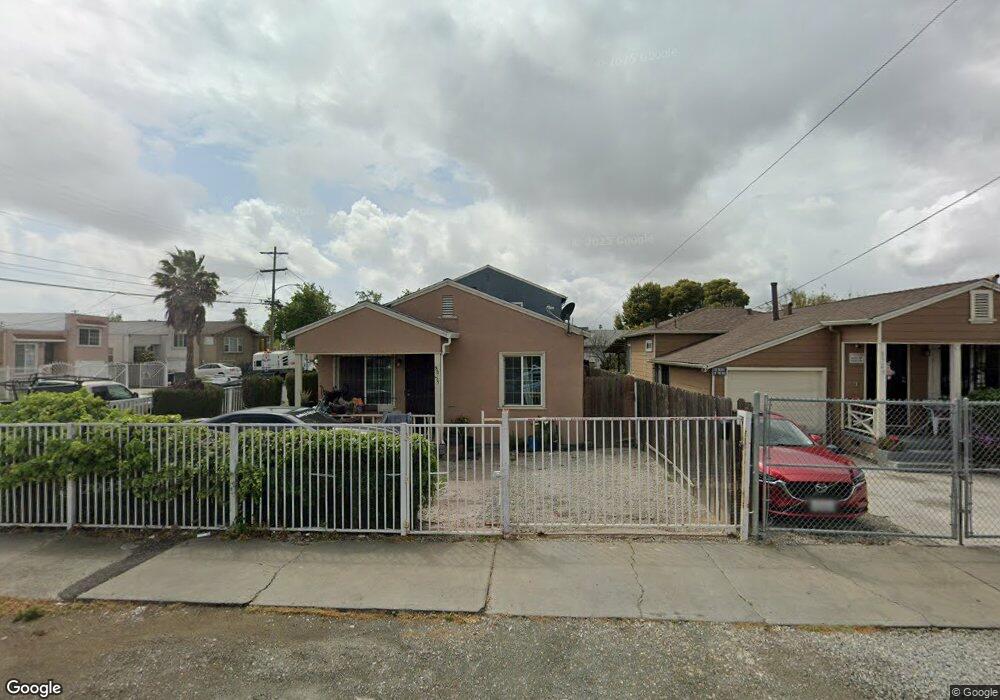
8935 A St Oakland, CA 94621
Highland NeighborhoodEstimated Value: $479,000 - $526,000
Studio
2
Baths
1,582
Sq Ft
$318/Sq Ft
Est. Value
About This Home
This home is located at 8935 A St, Oakland, CA 94621 and is currently estimated at $502,500, approximately $317 per square foot. 8935 A St is a home located in Alameda County with nearby schools including New Highland Academy, Acorn Woodland Elementary School, and Encompass Academy Elementary.
Ownership History
Date
Name
Owned For
Owner Type
Purchase Details
Closed on
Nov 16, 2015
Sold by
Siordia Carlos and Siordia Celia
Bought by
Siordia Family Trust
Current Estimated Value
Purchase Details
Closed on
Mar 29, 2007
Sold by
Siordia Carlos
Bought by
Siordia Carlos and Siordia Celia
Home Financials for this Owner
Home Financials are based on the most recent Mortgage that was taken out on this home.
Original Mortgage
$108,500
Interest Rate
6.37%
Mortgage Type
Commercial
Create a Home Valuation Report for This Property
The Home Valuation Report is an in-depth analysis detailing your home's value as well as a comparison with similar homes in the area
Home Values in the Area
Average Home Value in this Area
Purchase History
| Date | Buyer | Sale Price | Title Company |
|---|---|---|---|
| Siordia Family Trust | -- | None Available | |
| Siordia Carlos | -- | None Available | |
| Siordia Carlos | $54,272 | First American Title Co |
Source: Public Records
Mortgage History
| Date | Status | Borrower | Loan Amount |
|---|---|---|---|
| Previous Owner | Siordia Carlos | $108,500 |
Source: Public Records
Tax History
| Year | Tax Paid | Tax Assessment Tax Assessment Total Assessment is a certain percentage of the fair market value that is determined by local assessors to be the total taxable value of land and additions on the property. | Land | Improvement |
|---|---|---|---|---|
| 2025 | $4,073 | $138,245 | $63,789 | $74,456 |
| 2024 | $4,073 | $135,535 | $62,538 | $72,997 |
| 2023 | $4,119 | $132,877 | $61,312 | $71,565 |
| 2022 | $3,870 | $130,272 | $60,110 | $70,162 |
| 2021 | $3,487 | $127,718 | $58,931 | $68,787 |
| 2020 | $3,445 | $126,408 | $58,327 | $68,081 |
| 2019 | $3,180 | $123,930 | $57,183 | $66,747 |
| 2018 | $3,116 | $121,500 | $56,062 | $65,438 |
| 2017 | $2,944 | $119,118 | $54,963 | $64,155 |
| 2016 | $2,767 | $116,783 | $53,886 | $62,897 |
| 2015 | $2,747 | $115,029 | $53,076 | $61,953 |
| 2014 | $2,850 | $112,776 | $52,037 | $60,739 |
Source: Public Records
Map
Nearby Homes
- 9028 A St
- 1302 91st Ave
- 1355 91st Ave
- 1311 87th Ave
- 1233 87th Ave
- 1331 87th Ave
- 9251 International Blvd
- 1146 86th Ave
- 1442 92nd Ave
- 9419 B St
- 9337 International Blvd
- 1605 Auseon Ave
- 1629 88th Ave
- 1211 96th Ave
- 947 91st Ave
- 1715 87th Ave
- 1468 84th Ave
- 1615 85th Ave
- 1317 83rd Ave
- 9639 International Blvd
Your Personal Tour Guide
Ask me questions while you tour the home.