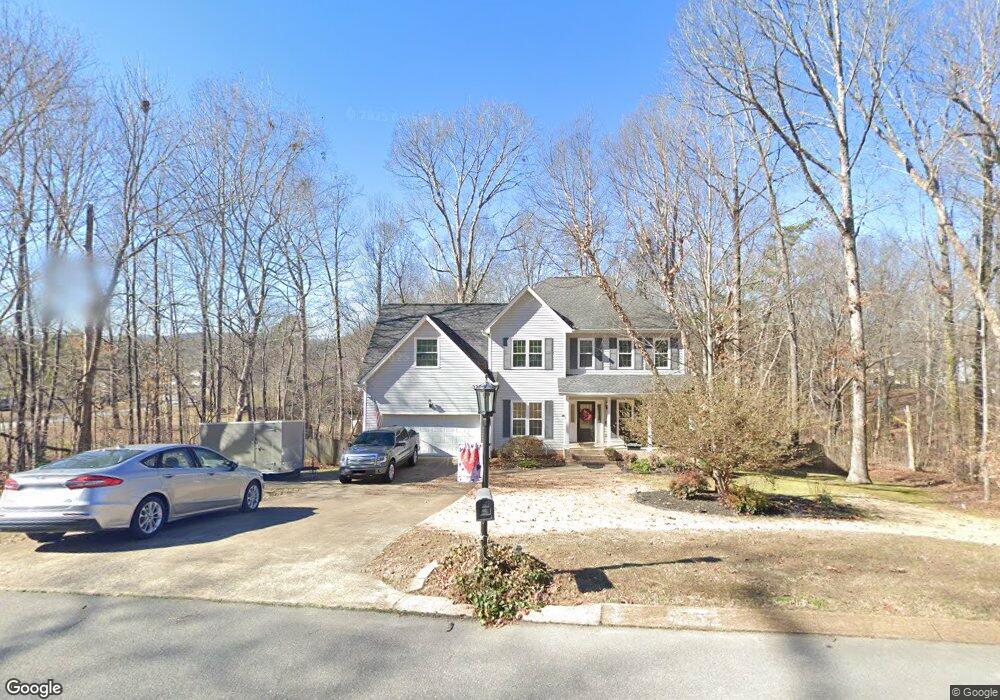
8935 Grey Mountain Dr Ooltewah, TN 37363
Estimated Value: $460,000 - $498,000
--
Bed
1
Bath
2,256
Sq Ft
$211/Sq Ft
Est. Value
About This Home
This home is located at 8935 Grey Mountain Dr, Ooltewah, TN 37363 and is currently estimated at $477,038, approximately $211 per square foot. 8935 Grey Mountain Dr is a home located in Hamilton County with nearby schools including Ooltewah Elementary School, Ooltewah Middle School, and Ooltewah High School.
Ownership History
Date
Name
Owned For
Owner Type
Purchase Details
Closed on
Jan 27, 2000
Sold by
Camp Katherine A and Lee Robert Lee
Bought by
Davenport Kevin T and Davenport Karen M
Current Estimated Value
Home Financials for this Owner
Home Financials are based on the most recent Mortgage that was taken out on this home.
Original Mortgage
$185,250
Outstanding Balance
$60,075
Interest Rate
7.9%
Estimated Equity
$416,963
Purchase Details
Closed on
Sep 17, 1997
Sold by
Boyle Stanley M and Boyle Margaret Ellen
Bought by
Camp Katherine A
Home Financials for this Owner
Home Financials are based on the most recent Mortgage that was taken out on this home.
Original Mortgage
$147,920
Interest Rate
7.37%
Mortgage Type
Unknown
Purchase Details
Closed on
May 30, 1996
Sold by
B P Construction Inc
Bought by
Boyle Stanley M and Boyle Margaret Ellen
Home Financials for this Owner
Home Financials are based on the most recent Mortgage that was taken out on this home.
Original Mortgage
$163,300
Interest Rate
7.93%
Purchase Details
Closed on
Sep 27, 1995
Bought by
B P Construction Inc
Create a Home Valuation Report for This Property
The Home Valuation Report is an in-depth analysis detailing your home's value as well as a comparison with similar homes in the area
Home Values in the Area
Average Home Value in this Area
Purchase History
| Date | Buyer | Sale Price | Title Company |
|---|---|---|---|
| Davenport Kevin T | $195,000 | -- | |
| Camp Katherine A | $184,900 | -- | |
| Boyle Stanley M | $171,900 | -- | |
| B P Construction Inc | $18,000 | -- |
Source: Public Records
Mortgage History
| Date | Status | Borrower | Loan Amount |
|---|---|---|---|
| Open | Davenport Kevin T | $185,250 | |
| Previous Owner | Camp Katherine A | $147,920 | |
| Previous Owner | Boyle Stanley M | $163,300 |
Source: Public Records
Tax History Compared to Growth
Tax History
| Year | Tax Paid | Tax Assessment Tax Assessment Total Assessment is a certain percentage of the fair market value that is determined by local assessors to be the total taxable value of land and additions on the property. | Land | Improvement |
|---|---|---|---|---|
| 2024 | $1,591 | $71,125 | $0 | $0 |
| 2023 | $2,703 | $71,125 | $0 | $0 |
| 2022 | $2,589 | $71,125 | $0 | $0 |
| 2021 | $2,589 | $71,125 | $0 | $0 |
| 2020 | $2,584 | $58,325 | $0 | $0 |
| 2019 | $2,584 | $58,325 | $0 | $0 |
| 2018 | $2,356 | $58,325 | $0 | $0 |
| 2017 | $2,356 | $58,325 | $0 | $0 |
| 2016 | $2,317 | $0 | $0 | $0 |
| 2015 | $2,317 | $55,800 | $0 | $0 |
| 2014 | $2,317 | $0 | $0 | $0 |
Source: Public Records
Map
Nearby Homes
- 8806 Grey Wolf Dr
- 5720 Edgmon Rd
- 5710 Edgmon Rd
- 8676 Bluegrass Ln
- 5634 Barrington Country Cir
- 5512 Barrington Country Cir
- 9713 Homewood Cir
- 5614 Jonquil Ln
- 9655 Hosta Ln
- 6048 White Oak Valley Cir
- 5618 Landrum Dr
- 5305 McDonald Rd
- 6052 Ridgeline Trail
- 8018 Ashview Cir
- 6124 Gilchrist Ln
- Lot 7 McDonald Rd
- 6107 Gilchrist Ln
- 10688 Pine Hill Rd
- 6118 Gilchrist Ln
- 5782 Louise Ln
- 8935 Grey Mountain Dr
- 8935 Grey Mountain Dr
- 8925 Grey Mountain Dr
- 8945 Grey Mountain Dr
- 8945 Grey Mountain Dr
- 8951 Grey Mountain Dr
- 8951 Grey Mountain Dr
- 8930 Grey Mountain Dr
- 8930 Grey Mountain Dr
- 8921 Grey Mountain Dr
- 8928 Grey Mountain Dr
- 8928 Grey Mountain Dr
- 8928 Grey Mountain Dr
- 8940 Grey Mountain Dr
- 8924 Grey Mountain Dr
- 8924 Grey Mountain Dr
- 8934 Grey Mountain Dr
- 8805 Grey Wolf Dr
- 8946 Grey Mountain Dr
- 8936 Grey Mountain Dr