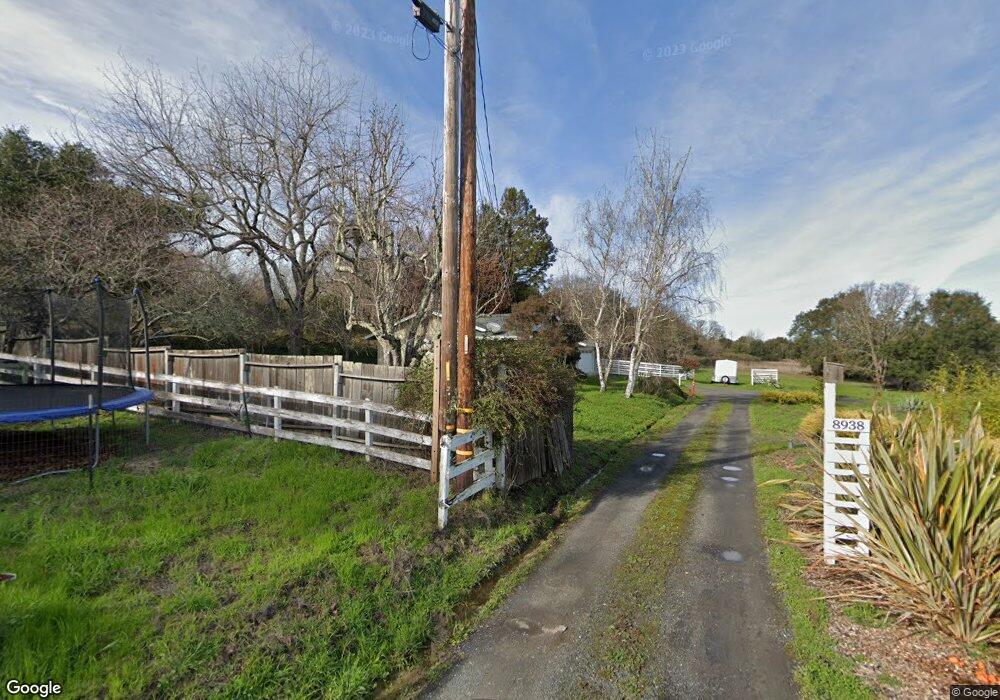
8938 Bodega Hwy Sebastopol, CA 95472
Estimated Value: $883,935 - $1,081,000
2
Beds
2
Baths
1,280
Sq Ft
$754/Sq Ft
Est. Value
About This Home
This home is located at 8938 Bodega Hwy, Sebastopol, CA 95472 and is currently estimated at $964,734, approximately $753 per square foot. 8938 Bodega Hwy is a home located in Sonoma County with nearby schools including Apple Blossom School, Analy High School, and Sunridge Charter School.
Ownership History
Date
Name
Owned For
Owner Type
Purchase Details
Closed on
Mar 17, 2021
Sold by
Gray James G and Pritchard Albert L
Bought by
Pritchard Albert Leon and Gray James Glenn
Current Estimated Value
Purchase Details
Closed on
Jun 4, 2003
Sold by
Davidson Mary T
Bought by
Gray James G and Pritchard Albert L
Home Financials for this Owner
Home Financials are based on the most recent Mortgage that was taken out on this home.
Original Mortgage
$320,000
Outstanding Balance
$138,445
Interest Rate
5.61%
Mortgage Type
Purchase Money Mortgage
Estimated Equity
$826,289
Purchase Details
Closed on
Sep 1, 1995
Sold by
Davidson Henry Bing
Bought by
Davidson Mary T
Home Financials for this Owner
Home Financials are based on the most recent Mortgage that was taken out on this home.
Original Mortgage
$193,400
Interest Rate
7.83%
Create a Home Valuation Report for This Property
The Home Valuation Report is an in-depth analysis detailing your home's value as well as a comparison with similar homes in the area
Home Values in the Area
Average Home Value in this Area
Purchase History
| Date | Buyer | Sale Price | Title Company |
|---|---|---|---|
| Pritchard Albert Leon | -- | None Available | |
| Gray James G | $450,000 | North American Title Co | |
| Davidson Mary T | -- | North American Title Co | |
| Davidson Mary T | $215,000 | North American Title Co |
Source: Public Records
Mortgage History
| Date | Status | Borrower | Loan Amount |
|---|---|---|---|
| Open | Gray James G | $320,000 | |
| Previous Owner | Davidson Mary T | $193,400 | |
| Closed | Gray James G | $39,900 |
Source: Public Records
Tax History Compared to Growth
Tax History
| Year | Tax Paid | Tax Assessment Tax Assessment Total Assessment is a certain percentage of the fair market value that is determined by local assessors to be the total taxable value of land and additions on the property. | Land | Improvement |
|---|---|---|---|---|
| 2025 | $7,683 | $651,604 | $434,504 | $217,100 |
| 2024 | $7,683 | $638,829 | $425,985 | $212,844 |
| 2023 | $7,683 | $626,304 | $417,633 | $208,671 |
| 2022 | $7,310 | $614,025 | $409,445 | $204,580 |
| 2021 | $7,166 | $601,986 | $401,417 | $200,569 |
| 2020 | $7,203 | $595,814 | $397,301 | $198,513 |
| 2019 | $6,855 | $584,132 | $389,511 | $194,621 |
| 2018 | $6,744 | $572,679 | $381,874 | $190,805 |
| 2017 | $6,449 | $561,451 | $374,387 | $187,064 |
| 2016 | $6,344 | $550,444 | $367,047 | $183,397 |
| 2015 | $6,137 | $542,177 | $361,534 | $180,643 |
| 2014 | $5,587 | $492,000 | $328,000 | $164,000 |
Source: Public Records
Map
Nearby Homes
- 0 Bodega Hwy
- 8148 Bodega Ave
- 788 Ferguson Rd
- 459 Gold Ridge Rd
- 8023 Washington Ave
- 1315 Ferguson Rd
- 200 Pleasant Hill Ave N
- 476 Pleasant Hill Ave N
- 1025 Laurel Ave
- 105 Virginia Ave Unit 3
- 1220 Gravenstein Hwy N
- 7720 Bodega Ave Unit 3
- 7600 Bodega Ave
- 7842 Joyce Dr
- 5200 California 116
- 7580 Meadowlark Dr
- 451 S High St
- 1369 Tilton Rd
- 2103 Peachland Ave
- 830 Litchfield Ave
- 8936 Bodega Hwy
- 8932 Bodega Hwy
- 8926 Bodega Hwy
- 8934 Bodega Hwy
- 0 Wilson Rd
- 8920 Bodega Hwy
- 190 Wilson Rd
- 111 Wilson Rd
- 8940 Bodega Hwy
- 8872 Bodega Hwy
- 8900 Bodega Hwy
- 8840 Bodega Hwy
- 9065 Bodega Hwy
- 8891 Bodega Hwy
- 8887 Bodega Hwy
- 8985 Bodega Hwy
- 420 Wilson Rd
- 9180 Bodega Hwy
- 110 Schuh Ln
- 406 Wilson Rd