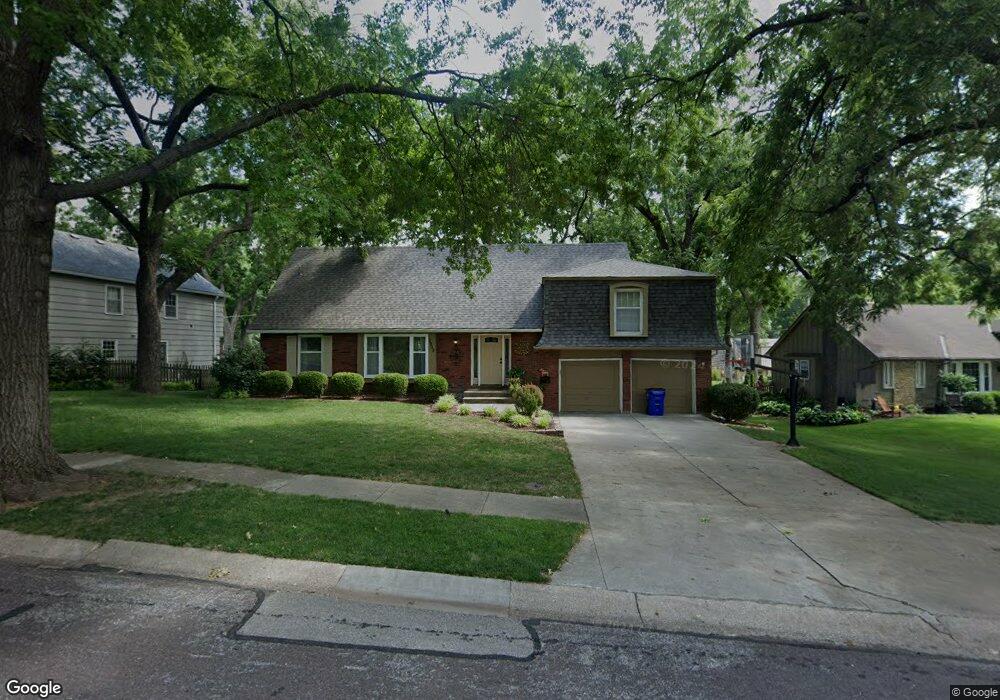
8938 Maple Cir Overland Park, KS 66207
Estimated Value: $511,000 - $585,000
4
Beds
3
Baths
2,148
Sq Ft
$254/Sq Ft
Est. Value
About This Home
This home is located at 8938 Maple Cir, Overland Park, KS 66207 and is currently estimated at $546,346, approximately $254 per square foot. 8938 Maple Cir is a home located in Johnson County with nearby schools including Briarwood Elementary School, Indian Hills Middle School, and Shawnee Mission East High School.
Ownership History
Date
Name
Owned For
Owner Type
Purchase Details
Closed on
Aug 5, 2025
Sold by
Anderson David A and Anderson Ruth J
Bought by
Anderson Family Living Trust and Anderson
Current Estimated Value
Purchase Details
Closed on
Apr 28, 2005
Sold by
Henrich Christin and Dollar Christin H
Bought by
Anderson David A and Anderson Ruth J
Home Financials for this Owner
Home Financials are based on the most recent Mortgage that was taken out on this home.
Original Mortgage
$48,750
Interest Rate
5.61%
Mortgage Type
Stand Alone Second
Purchase Details
Closed on
Nov 18, 2002
Sold by
Peterson Donald R and Peterson Laura M
Bought by
Dollar Lawrence E and Dollar Christin H
Home Financials for this Owner
Home Financials are based on the most recent Mortgage that was taken out on this home.
Original Mortgage
$178,000
Interest Rate
5.89%
Create a Home Valuation Report for This Property
The Home Valuation Report is an in-depth analysis detailing your home's value as well as a comparison with similar homes in the area
Home Values in the Area
Average Home Value in this Area
Purchase History
| Date | Buyer | Sale Price | Title Company |
|---|---|---|---|
| Anderson Family Living Trust | -- | -- | |
| Anderson David A | -- | Chicago Title Insurance Co | |
| Dollar Lawrence E | -- | Nations Title Agency Inc |
Source: Public Records
Mortgage History
| Date | Status | Borrower | Loan Amount |
|---|---|---|---|
| Previous Owner | Anderson David A | $48,750 | |
| Previous Owner | Anderson David A | $194,400 | |
| Previous Owner | Dollar Lawrence E | $178,000 |
Source: Public Records
Tax History Compared to Growth
Tax History
| Year | Tax Paid | Tax Assessment Tax Assessment Total Assessment is a certain percentage of the fair market value that is determined by local assessors to be the total taxable value of land and additions on the property. | Land | Improvement |
|---|---|---|---|---|
| 2024 | $5,817 | $59,708 | $12,111 | $47,597 |
| 2023 | $5,389 | $54,832 | $12,111 | $42,721 |
| 2022 | $4,878 | $50,002 | $12,111 | $37,891 |
| 2021 | $4,524 | $44,263 | $9,323 | $34,940 |
| 2020 | $4,252 | $41,642 | $7,779 | $33,863 |
| 2019 | $3,954 | $38,766 | $5,983 | $32,783 |
| 2018 | $3,712 | $36,248 | $5,983 | $30,265 |
| 2017 | $3,415 | $32,809 | $5,983 | $26,826 |
| 2016 | $3,383 | $31,970 | $5,983 | $25,987 |
| 2015 | $2,747 | $26,508 | $5,440 | $21,068 |
| 2013 | -- | $25,853 | $5,440 | $20,413 |
Source: Public Records
Map
Nearby Homes
- 9015 Outlook Dr
- 8932 Nall Ave
- 5615 W 91st St
- 9100 Dearborn St
- 8818 Birch Ln
- 5516 W 87th Terrace
- 9234 Woodson Dr
- 9307 Woodson Dr
- 9111 Walmer St
- 4969 W 88th St
- 6201 W 86th Terrace
- 5300 W 101st Terrace
- 5911 W 94th Terrace
- 5482 W 85th Terrace
- 6108 W 85th Terrace
- 6116 W 85th Terrace
- 9445 Rosewood Dr Unit 2A
- 6600 W 93rd Terrace
- 6118 W 95th St
- Winston Plan at Meadowbrook Park
- 8936 Maple Cir
- 8940 Maple Cir
- 5606 W 90th Terrace
- 5602 W 90th Terrace
- 8940 Maple Dr
- 8928 Maple Cir
- 5612 W 90th Terrace
- 8926 Maple Dr
- 8934 Maple Cir
- 9001 Maple Dr
- 8920 Maple Dr
- 5702 W 90th Terrace
- 8941 Maple Dr
- 5605 W 90th Terrace
- 8927 Maple Dr
- 5611 W 90th Terrace
- 8932 Maple Cir
- 5601 W 90th Terrace
- 8914 Maple Dr
- 5514 W 90th Terrace