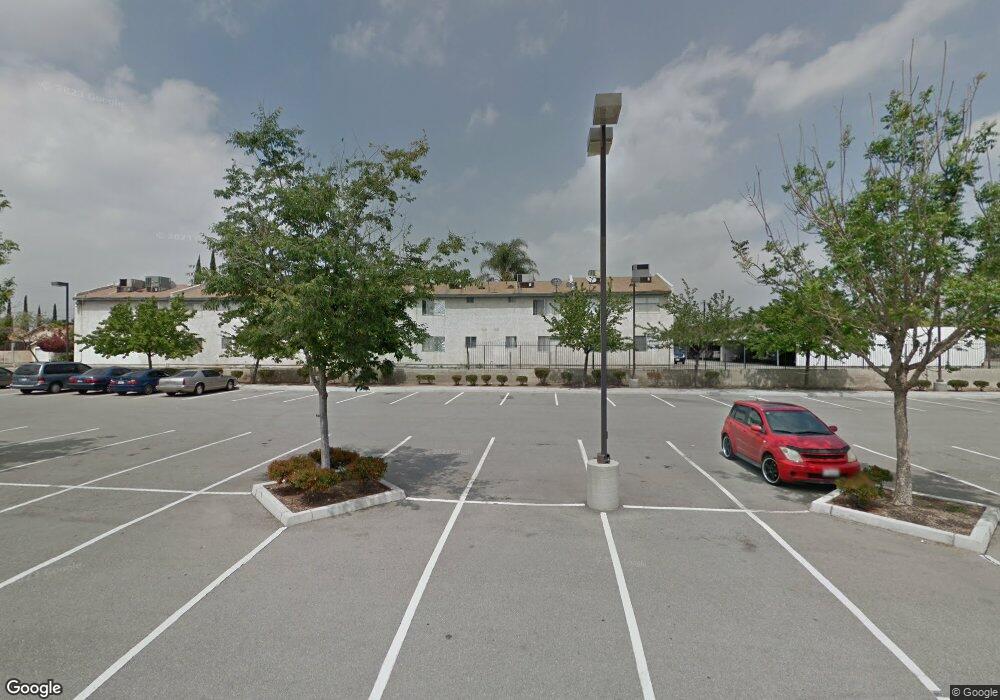
8939 Mango Ave Unit 3 Fontana, CA 92335
Estimated Value: $264,000 - $294,000
2
Beds
2
Baths
960
Sq Ft
$290/Sq Ft
Est. Value
About This Home
This home is located at 8939 Mango Ave Unit 3, Fontana, CA 92335 and is currently estimated at $278,096, approximately $289 per square foot. 8939 Mango Ave Unit 3 is a home located in San Bernardino County with nearby schools including Palmetto Elementary School, Fontana Middle School, and Jurupa Hills High School.
Ownership History
Date
Name
Owned For
Owner Type
Purchase Details
Closed on
Nov 19, 2009
Sold by
Mendoza Carlos J
Bought by
Mendoza Carlos J and Mendoza Emma C
Current Estimated Value
Purchase Details
Closed on
Jan 22, 2009
Sold by
Equity Trust Company
Bought by
Mendoza Carlos J and Mendoza Emma C
Purchase Details
Closed on
Sep 25, 2008
Sold by
Wachovia Mortgage Fsb
Bought by
Equity Trust Company Custodian and Rick Solis Ira #39738
Purchase Details
Closed on
Aug 14, 2008
Sold by
Chayer Yeny
Bought by
Wachovia Mortgage Fsb and World Savings Bank Fsb
Purchase Details
Closed on
Jul 6, 2000
Sold by
Chayeb Pedro
Bought by
Chayeb Yeny
Purchase Details
Closed on
Jul 10, 1996
Sold by
Kolber Md Morton
Bought by
Kolber Morton and 1996 Kolber Family Trust
Create a Home Valuation Report for This Property
The Home Valuation Report is an in-depth analysis detailing your home's value as well as a comparison with similar homes in the area
Purchase History
| Date | Buyer | Sale Price | Title Company |
|---|---|---|---|
| Mendoza Carlos J | -- | None Available | |
| Mendoza Carlos J | $49,000 | Fidelity National Title Co | |
| Equity Trust Company Custodian | -- | Fidelity National Title Co | |
| Wachovia Mortgage Fsb | $57,400 | Stewart Title Co | |
| Chayeb Yeny | -- | -- | |
| Kolber Morton | -- | -- |
Source: Public Records
Tax History Compared to Growth
Tax History
| Year | Tax Paid | Tax Assessment Tax Assessment Total Assessment is a certain percentage of the fair market value that is determined by local assessors to be the total taxable value of land and additions on the property. | Land | Improvement |
|---|---|---|---|---|
| 2025 | $674 | $59,379 | $15,491 | $43,888 |
| 2024 | $628 | $58,214 | $15,187 | $43,027 |
| 2023 | $612 | $57,072 | $14,889 | $42,183 |
| 2022 | $609 | $55,953 | $14,597 | $41,356 |
| 2021 | $602 | $54,856 | $14,311 | $40,545 |
| 2020 | $600 | $54,293 | $14,164 | $40,129 |
| 2019 | $583 | $53,228 | $13,886 | $39,342 |
| 2018 | $591 | $52,185 | $13,614 | $38,571 |
| 2017 | $588 | $51,162 | $13,347 | $37,815 |
| 2016 | $578 | $50,159 | $13,085 | $37,074 |
| 2015 | $571 | $49,405 | $12,888 | $36,517 |
| 2014 | $572 | $48,438 | $12,636 | $35,802 |
Source: Public Records
Map
Nearby Homes
- 8939 Mango Ave Unit I
- 8939 Mango Ave Unit F
- 8870 Blanchard Ave
- 9100 Acacia Ave Unit 9
- 17232 Ceres Ave
- 9115 Encinitas Ave
- 9236 Mango Ave
- 8671 Wheeler Ave
- Newbridge Plan at Summit Park - Paloma
- Ballard Plan at Summit Park - Aurora
- Bastian Plan at Summit Park - Aurora
- Niagra Plan at Summit Park - Paloma
- Barbara Plan at Summit Park - Aurora
- 17053 Pinedale Ct
- 9074 Olive St
- 8641 Sierra Ave
- 8548 Kempster Ave
- 0 Valencia Ave Unit IG25133148
- 16748 Athol St
- 8868 Juniper Ave
- 8939 Mango Ave Unit T
- 8939 Mango Ave Unit K
- 8939 Mango Ave
- 8939 Mango Ave Unit P
- 8939 Mango Ave Unit C
- 8939 Mango Ave Unit O
- 8939 Mango Ave Unit M
- 8939 Mango Ave Unit G
- 8939 Mango Ave Unit A
- 8939 Mango Ave Unit 12
- 8939 Mango Ave Unit J
- 8939 Mango Ave Unit S
- 8939 Mango Ave Unit 5
- 8939 Mango Ave Unit Q
- 8939 Mango Ave Unit L
- 8939 Mango Ave Unit 7
- 8939 Mango Ave Unit 11
- 8939 Mango Ave Unit 14
- 8939 Mango Ave Unit 13
- 8939 Mango Ave Unit 19