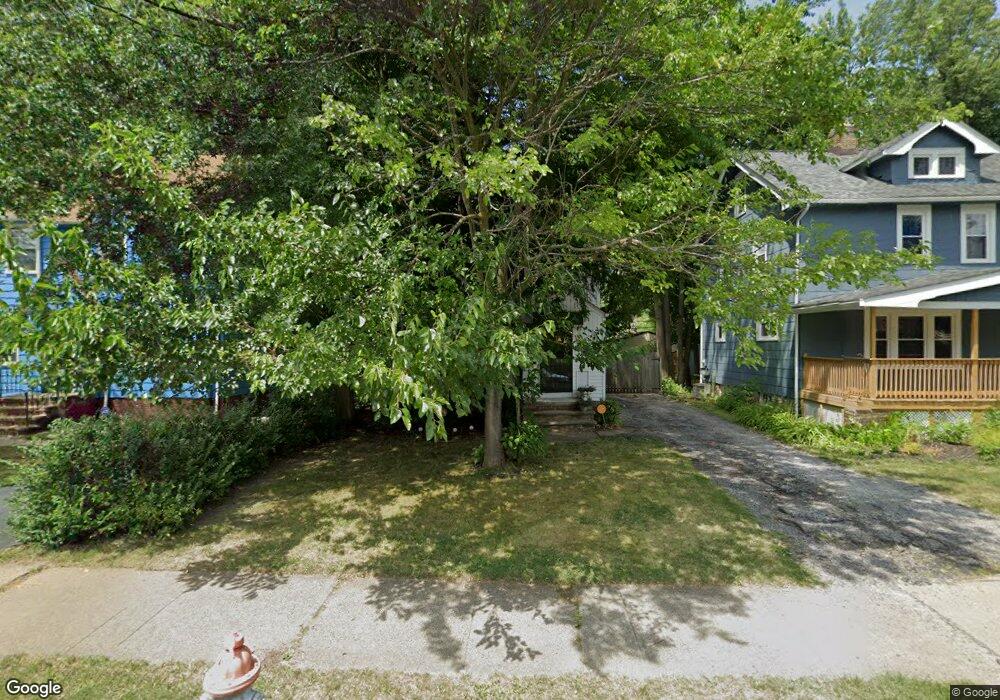
894 Nela View Rd Cleveland, OH 44112
Monticello-Noble NeighborhoodEstimated Value: $124,470 - $157,000
2
Beds
2
Baths
1,036
Sq Ft
$134/Sq Ft
Est. Value
About This Home
This home is located at 894 Nela View Rd, Cleveland, OH 44112 and is currently estimated at $138,868, approximately $134 per square foot. 894 Nela View Rd is a home located in Cuyahoga County with nearby schools including A.C. Jones Health Professions Magnet Academy, Shaw High School, and Apex Academy.
Ownership History
Date
Name
Owned For
Owner Type
Purchase Details
Closed on
Dec 15, 2011
Sold by
Baines Tricia M
Bought by
Robinson Yvonne
Current Estimated Value
Purchase Details
Closed on
Oct 16, 2007
Sold by
Sanders Maurise
Bought by
Baines Tricia M
Home Financials for this Owner
Home Financials are based on the most recent Mortgage that was taken out on this home.
Original Mortgage
$58,900
Interest Rate
6.5%
Mortgage Type
Purchase Money Mortgage
Purchase Details
Closed on
Jul 26, 2007
Sold by
Fannie Mae
Bought by
Sanders Maurise
Purchase Details
Closed on
Aug 18, 2006
Sold by
Stevens Kenyon and Stevens Shantale R
Bought by
Federal National Mortgage Association
Purchase Details
Closed on
Jul 27, 1988
Sold by
Perry Robert L
Bought by
Stevens Kenyon
Purchase Details
Closed on
Nov 30, 1984
Sold by
Jones Dorothy
Bought by
Perry Robert L
Purchase Details
Closed on
Jul 11, 1977
Sold by
Perry Thomas C
Bought by
Jones Dorothy
Purchase Details
Closed on
Jan 1, 1975
Bought by
Knaggs Minnie B
Create a Home Valuation Report for This Property
The Home Valuation Report is an in-depth analysis detailing your home's value as well as a comparison with similar homes in the area
Home Values in the Area
Average Home Value in this Area
Purchase History
| Date | Buyer | Sale Price | Title Company |
|---|---|---|---|
| Robinson Yvonne | $82,000 | None Available | |
| Baines Tricia M | $62,000 | Title Assurance Corp | |
| Sanders Maurise | $6,000 | Phoenix Title Agency | |
| Federal National Mortgage Association | $53,334 | Attorney | |
| Stevens Kenyon | $44,000 | -- | |
| Perry Robert L | $32,500 | -- | |
| Jones Dorothy | -- | -- | |
| Perry Thomas C | $21,000 | -- | |
| Knaggs Minnie B | -- | -- |
Source: Public Records
Mortgage History
| Date | Status | Borrower | Loan Amount |
|---|---|---|---|
| Previous Owner | Baines Tricia M | $58,900 |
Source: Public Records
Tax History Compared to Growth
Tax History
| Year | Tax Paid | Tax Assessment Tax Assessment Total Assessment is a certain percentage of the fair market value that is determined by local assessors to be the total taxable value of land and additions on the property. | Land | Improvement |
|---|---|---|---|---|
| 2024 | $2,538 | $40,250 | $7,700 | $32,550 |
| 2023 | $2,290 | $26,150 | $3,570 | $22,580 |
| 2022 | $2,283 | $26,145 | $3,570 | $22,575 |
| 2021 | $2,264 | $26,150 | $3,570 | $22,580 |
| 2020 | $2,217 | $23,560 | $3,220 | $20,340 |
| 2019 | $2,326 | $67,300 | $9,200 | $58,100 |
| 2018 | $2,236 | $23,560 | $3,220 | $20,340 |
| 2017 | $2,577 | $21,950 | $4,270 | $17,680 |
| 2016 | $2,057 | $21,950 | $4,270 | $17,680 |
| 2015 | $10,163 | $21,950 | $4,270 | $17,680 |
| 2014 | $10,163 | $26,430 | $5,150 | $21,280 |
Source: Public Records
Map
Nearby Homes
- 885 Helmsdale Rd
- 907 Nela View Rd
- 841 Helmsdale Rd
- 861 Caledonia Ave
- 931 Helmsdale Rd
- 916 Whitby Rd
- 939 Helmsdale Rd
- 839 Nela View Rd
- 825 Helmsdale Rd
- 833 Nela View Rd
- 828 Nela View Rd
- 817 Helmsdale Rd
- 935 Ravine Dr
- 965 Whitby Rd
- 991 Helmsdale Rd
- 945 Dresden Rd
- 877 Woodview Rd Unit 101
- 901 Woodview Rd
- 16208 Greyton Rd
- 936 Dresden Rd
- 890 Nela View Rd
- 898 Nela View Rd
- 886 Nela View Rd
- 902 Nela View Rd
- 904 Nela View Rd
- 881 Helmsdale Rd
- 889 Helmsdale Rd
- 877 Helmsdale Rd
- 893 Helmsdale Rd
- 873 Helmsdale Rd
- 880 Nela View Rd
- 906 Nela View Rd
- 895 Nela View Rd
- 895 Helmsdale Rd
- 891 Nela View Rd
- 899 Nela View Rd
- 887 Nela View Rd
- 869 Helmsdale Rd
- 903 Nela View Rd
- 901 Helmsdale Rd