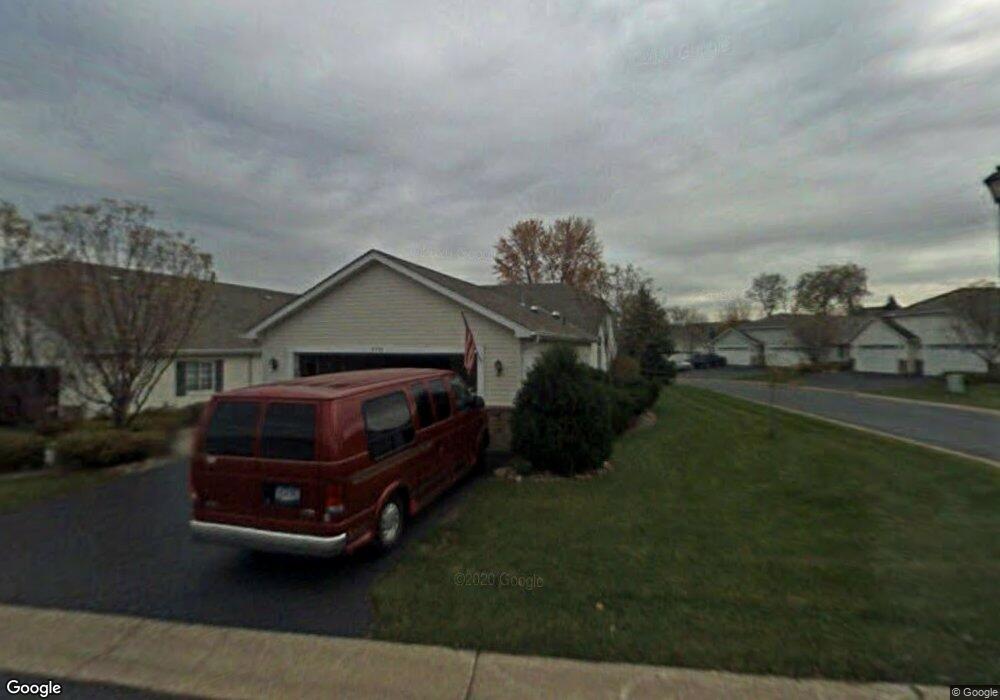
8943 Thomas Dr Woodbury, MN 55125
Estimated Value: $328,829 - $348,000
2
Beds
2
Baths
1,593
Sq Ft
$212/Sq Ft
Est. Value
About This Home
This home is located at 8943 Thomas Dr, Woodbury, MN 55125 and is currently estimated at $336,957, approximately $211 per square foot. 8943 Thomas Dr is a home located in Washington County with nearby schools including Eagle Point Elementary School, Skyview Community Elementary School, and Skyview Community Middle School.
Ownership History
Date
Name
Owned For
Owner Type
Purchase Details
Closed on
Jun 26, 2023
Sold by
Nelson Nicolee and Nelson Steven
Bought by
Gustafson Donald Charles and Gustafson Marguerite Ellen
Current Estimated Value
Purchase Details
Closed on
May 4, 2023
Sold by
Haak Jayne B and Haak Bette Jayne
Bought by
Haak Christopher A and Nelson Nicolee
Purchase Details
Closed on
Aug 18, 2022
Sold by
Miner Suzanne and Miner Todd
Bought by
Gustafson Donald and Gustafson Marguerite
Purchase Details
Closed on
Nov 21, 2019
Sold by
Haak Louis A and Haak Bette Jayne B
Bought by
Haak Louis A and Haak Bette Jayne B
Purchase Details
Closed on
May 30, 2018
Sold by
Haak Louis A and Haak Bette Jayne B
Bought by
Haak Louis A and Haak Bette Jayne B
Purchase Details
Closed on
Aug 1, 2016
Sold by
Nehring Marilyn Y
Bought by
Haak Louis A and Haak Bette Jayne B
Purchase Details
Closed on
Feb 20, 1996
Sold by
Thone Builders
Bought by
Nehring Jerome S and Nehring Marilyn Y
Create a Home Valuation Report for This Property
The Home Valuation Report is an in-depth analysis detailing your home's value as well as a comparison with similar homes in the area
Home Values in the Area
Average Home Value in this Area
Purchase History
| Date | Buyer | Sale Price | Title Company |
|---|---|---|---|
| Gustafson Donald Charles | $315,000 | Land Title | |
| Haak Christopher A | -- | Edina Realty Title | |
| Gustafson Donald | $315,000 | -- | |
| Haak Louis A | -- | None Available | |
| Haak Louis A | -- | None Available | |
| Haak Louis A | $240,000 | Edina Realty Title Inc | |
| Nehring Jerome S | $128,655 | -- |
Source: Public Records
Tax History Compared to Growth
Tax History
| Year | Tax Paid | Tax Assessment Tax Assessment Total Assessment is a certain percentage of the fair market value that is determined by local assessors to be the total taxable value of land and additions on the property. | Land | Improvement |
|---|---|---|---|---|
| 2024 | $3,466 | $322,200 | $113,000 | $209,200 |
| 2023 | $3,466 | $335,700 | $133,000 | $202,700 |
| 2022 | $3,102 | $306,300 | $127,200 | $179,100 |
| 2021 | $2,882 | $270,900 | $112,500 | $158,400 |
| 2020 | $2,790 | $260,700 | $112,500 | $148,200 |
| 2019 | $2,742 | $244,800 | $95,000 | $149,800 |
| 2018 | $2,638 | $243,100 | $102,000 | $141,100 |
| 2017 | $2,466 | $228,400 | $92,000 | $136,400 |
| 2016 | $2,104 | $202,600 | $70,000 | $132,600 |
| 2015 | $1,750 | $134,000 | $21,300 | $112,700 |
| 2013 | -- | $109,600 | $18,400 | $91,200 |
Source: Public Records
Map
Nearby Homes
- 8878 Spring Ln
- 201 Pendryn Hill Curve
- 267 Pendryn Hill Ct
- 395 Pendryn Hill Curve
- 772 Winterberry Dr
- 9342 Preserve Trail
- 9249 Troon Ct
- 9245 Troon Ct
- 936 Winterberry Dr
- 9383 Turnberry Alcove
- 1095 Scarborough Ln
- 9109 Jade Cir N
- 1102 Fallbrook Ln
- 815 Woodduck Dr
- 1322 Bridle Path Ct
- 9085 Jade Ct N
- 1311 Fallbrook Ln
- 577 Woodduck Dr Unit E
- 8764 Pinehurst Bay
- 1329 Carriage Rd