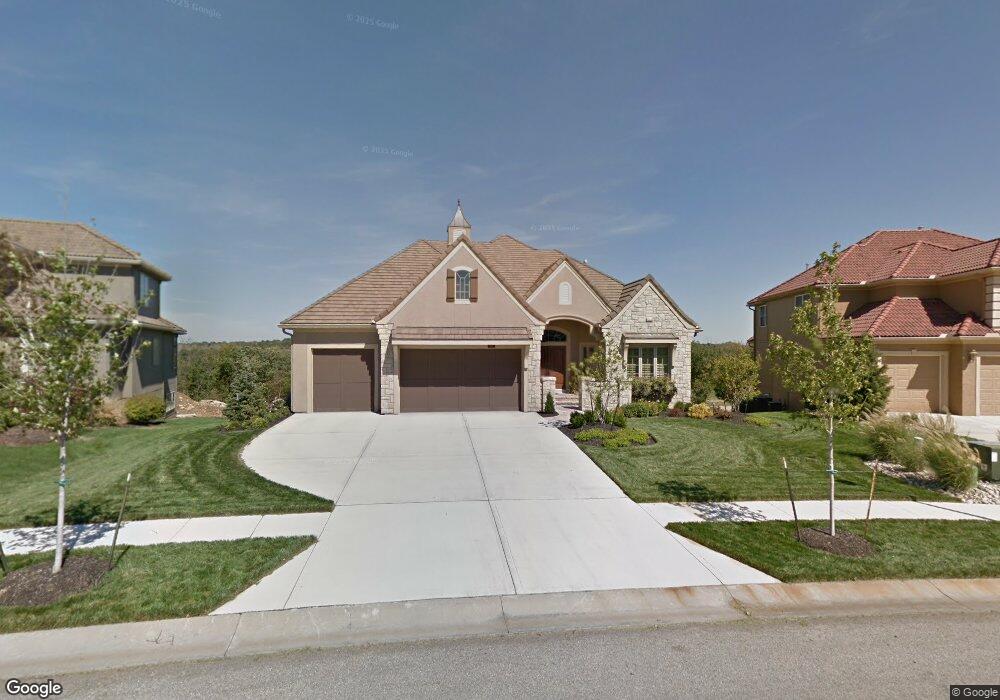
8947 Chestnut St Lenexa, KS 66220
Estimated Value: $735,283 - $825,000
4
Beds
5
Baths
2,587
Sq Ft
$300/Sq Ft
Est. Value
About This Home
This home is located at 8947 Chestnut St, Lenexa, KS 66220 and is currently estimated at $775,821, approximately $299 per square foot. 8947 Chestnut St is a home located in Johnson County with nearby schools including Manchester Park Elementary School, Prairie Trail Middle School, and Olathe Northwest High School.
Ownership History
Date
Name
Owned For
Owner Type
Purchase Details
Closed on
Dec 23, 2022
Sold by
Bergstrand Richard A and Bergstrand Gayle G
Bought by
Bergstrand Richard A and Bergstrand Gayle G
Current Estimated Value
Purchase Details
Closed on
Jun 1, 2010
Sold by
Corporate Holdings Ii L L C
Bought by
Bergstrand Richard A and Bergstrand Gayle G
Purchase Details
Closed on
Jan 27, 2010
Sold by
Rounbehler Construction Inc
Bought by
Corporate Holdings Ii L L C
Purchase Details
Closed on
Aug 29, 2006
Sold by
Julian Morrissey Horn Development Co Lc
Bought by
Rounbehler Construction Inc
Home Financials for this Owner
Home Financials are based on the most recent Mortgage that was taken out on this home.
Original Mortgage
$99,900
Interest Rate
6.64%
Mortgage Type
Future Advance Clause Open End Mortgage
Create a Home Valuation Report for This Property
The Home Valuation Report is an in-depth analysis detailing your home's value as well as a comparison with similar homes in the area
Home Values in the Area
Average Home Value in this Area
Purchase History
| Date | Buyer | Sale Price | Title Company |
|---|---|---|---|
| Bergstrand Richard A | -- | None Listed On Document | |
| Bergstrand Richard A | -- | Kansas City Title | |
| Corporate Holdings Ii L L C | -- | None Available | |
| Rounbehler Construction Inc | -- | Kansas Secured Title |
Source: Public Records
Mortgage History
| Date | Status | Borrower | Loan Amount |
|---|---|---|---|
| Previous Owner | Rounbehler Construction Inc | $99,900 |
Source: Public Records
Tax History Compared to Growth
Tax History
| Year | Tax Paid | Tax Assessment Tax Assessment Total Assessment is a certain percentage of the fair market value that is determined by local assessors to be the total taxable value of land and additions on the property. | Land | Improvement |
|---|---|---|---|---|
| 2024 | $10,655 | $86,457 | $15,841 | $70,616 |
| 2023 | $10,150 | $81,121 | $15,841 | $65,280 |
| 2022 | $9,436 | $73,554 | $13,199 | $60,355 |
| 2021 | $8,769 | $65,159 | $13,199 | $51,960 |
| 2020 | $8,911 | $65,596 | $13,199 | $52,397 |
| 2019 | $8,789 | $64,216 | $10,999 | $53,217 |
| 2017 | $8,230 | $58,167 | $11,001 | $47,166 |
| 2016 | $7,783 | $56,258 | $10,481 | $45,777 |
Source: Public Records
Map
Nearby Homes
- 20415 W 88th Terrace
- 20308 W 92nd St
- 8920 Pine St
- 19430 W 87th Ln
- 20413 Crickett Ln
- 9425 Pinnacle St
- 0 W 95th St
- 9517 Falcon Ridge Dr
- 21359 W 93rd Ct
- 9238 Marion St
- 9636 Cailler Dr
- 9268 Brownridge St
- 9259 Deer Run St
- 9450 Marion St
- 9410 Deer Run St
- 20914 W 96th Terrace
- 22068 W 94th Terrace
- 22105 W 94th Terrace
- 22140 W 94th Terrace
- 22092 W 94th Terrace
- 8951 Chestnut St
- 8943 Chestnut St
- 8955 Chestnut St
- 8950 Chestnut St
- 8939 Chestnut St
- 20024 W 89th St
- 20018 W 89th St
- 20036 W 89th St
- 20104 W 90th St
- 8959 Chestnut St
- 20012 W 89th St
- 20108 W 90th St
- 20040 W 89th St
- 8935 Chestnut St
- 8915 Vista Dr
- 20112 W 90th St
- 20006 W 89th St
- 20004 W 89th St
- 20102 W 89th St
- 8911 Vista Dr