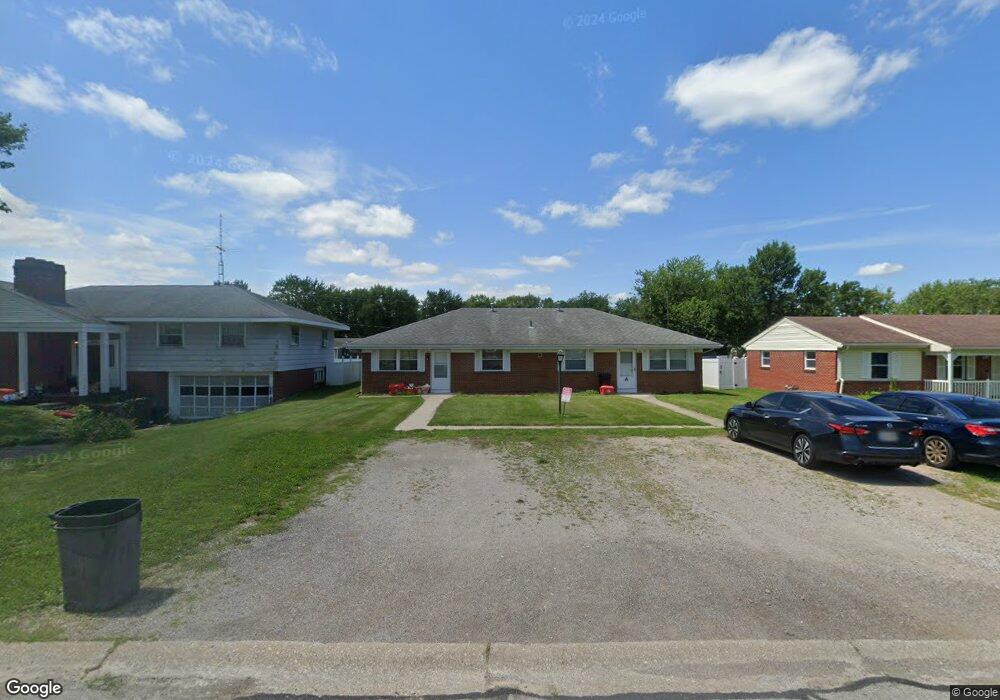
895 Dagget Dr Napoleon, OH 43545
Estimated Value: $151,000 - $242,000
4
Beds
1
Bath
1,736
Sq Ft
$106/Sq Ft
Est. Value
About This Home
This home is located at 895 Dagget Dr, Napoleon, OH 43545 and is currently estimated at $183,419, approximately $105 per square foot. 895 Dagget Dr is a home located in Henry County with nearby schools including Napoleon Elementary School, Napoleon Junior/Senior High School, and St. Augustine School.
Ownership History
Date
Name
Owned For
Owner Type
Purchase Details
Closed on
Oct 31, 2011
Sold by
The Henry County Bank
Bought by
Marpeb Llc
Current Estimated Value
Purchase Details
Closed on
Oct 25, 2011
Sold by
Holt Investment Properties Llc
Bought by
The Henry County Bank
Purchase Details
Closed on
Jan 10, 2005
Sold by
Rohrs Kay A
Bought by
Holt Investment Properties Llc
Home Financials for this Owner
Home Financials are based on the most recent Mortgage that was taken out on this home.
Original Mortgage
$396,000
Interest Rate
7.75%
Mortgage Type
Unknown
Purchase Details
Closed on
Dec 8, 2004
Sold by
Estate Of Edmund F Rohrs
Bought by
Rohrs Kay A
Home Financials for this Owner
Home Financials are based on the most recent Mortgage that was taken out on this home.
Original Mortgage
$396,000
Interest Rate
7.75%
Mortgage Type
Unknown
Purchase Details
Closed on
Jun 2, 1999
Sold by
Margaret Miller Trst
Bought by
Rohrs Edmund F
Create a Home Valuation Report for This Property
The Home Valuation Report is an in-depth analysis detailing your home's value as well as a comparison with similar homes in the area
Home Values in the Area
Average Home Value in this Area
Purchase History
| Date | Buyer | Sale Price | Title Company |
|---|---|---|---|
| Marpeb Llc | $68,000 | Attorney | |
| The Henry County Bank | $68,000 | Attorney | |
| Holt Investment Properties Llc | $405,000 | -- | |
| Rohrs Kay A | -- | -- | |
| Rohrs Edmund F | $65,000 | -- |
Source: Public Records
Mortgage History
| Date | Status | Borrower | Loan Amount |
|---|---|---|---|
| Previous Owner | Holt Investment Properties Llc | $396,000 |
Source: Public Records
Tax History
| Year | Tax Paid | Tax Assessment Tax Assessment Total Assessment is a certain percentage of the fair market value that is determined by local assessors to be the total taxable value of land and additions on the property. | Land | Improvement |
|---|---|---|---|---|
| 2024 | $1,876 | $44,350 | $7,400 | $36,950 |
| 2023 | $1,678 | $44,350 | $7,400 | $36,950 |
| 2022 | $1,692 | $73,800 | $12,220 | $61,580 |
| 2021 | $1,692 | $36,900 | $6,110 | $30,790 |
| 2020 | $1,779 | $36,900 | $6,110 | $30,790 |
| 2019 | $1,584 | $31,870 | $5,710 | $26,160 |
| 2018 | $1,547 | $31,870 | $5,710 | $26,160 |
| 2017 | $1,489 | $31,870 | $5,710 | $26,160 |
| 2016 | $1,432 | $29,750 | $5,710 | $24,040 |
| 2015 | $1,407 | $29,750 | $5,710 | $24,040 |
| 2014 | $1,548 | $29,750 | $5,710 | $24,040 |
| 2013 | $1,548 | $30,500 | $5,710 | $24,790 |
Source: Public Records
Map
Nearby Homes
- 889 Dagget Dr
- 901 Dagget Dr
- 889 Daggett Ave
- 892 E Graceway Dr
- 881 Dagget Dr
- 909 Dagget Dr
- 909 Daggett Ave
- 882 E Graceway Dr
- 900 E Graceway Dr
- 875 Dagget Dr
- 878 E Graceway Dr
- 917 Dagget Dr
- 910 E Graceway Dr
- 917 Daggett Ave
- 894 Dagget Dr
- 900 Dagget Dr
- 888 Dagget Dr
- 867 Dagget Dr
- 908 Dagget Dr
- 893 E Graceway Dr
Your Personal Tour Guide
Ask me questions while you tour the home.