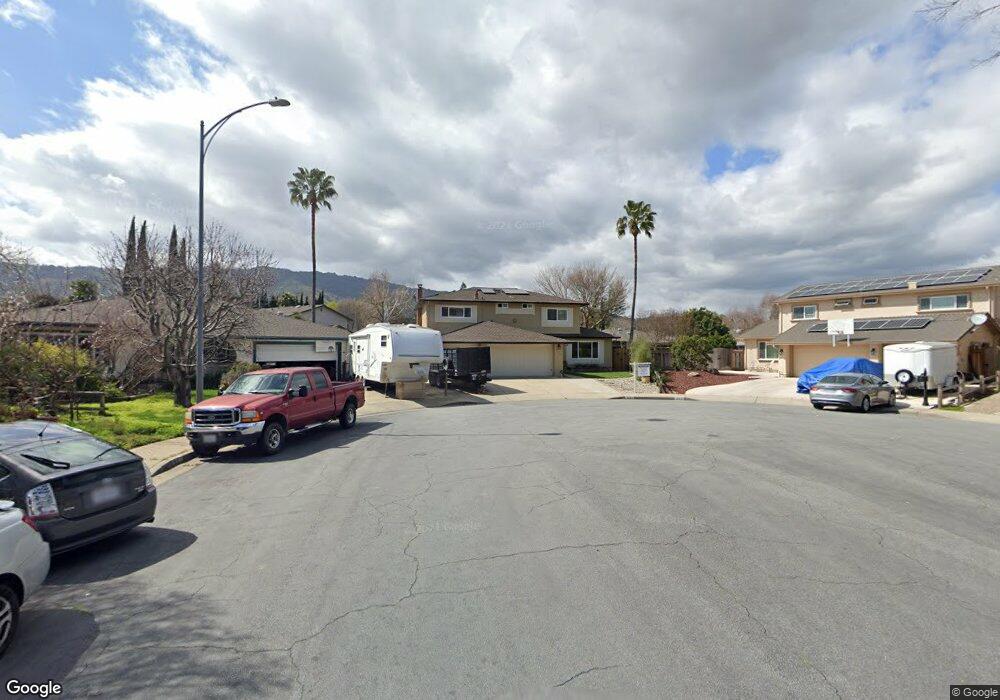
895 Dearborn Place Gilroy, CA 95020
Estimated Value: $992,000 - $1,170,000
5
Beds
3
Baths
2,590
Sq Ft
$424/Sq Ft
Est. Value
About This Home
This home is located at 895 Dearborn Place, Gilroy, CA 95020 and is currently estimated at $1,098,731, approximately $424 per square foot. 895 Dearborn Place is a home located in Santa Clara County with nearby schools including Glen View Elementary School, Solorsano Middle School, and Gilroy High School.
Ownership History
Date
Name
Owned For
Owner Type
Purchase Details
Closed on
Mar 18, 2019
Sold by
Sandoval John and Sandoval Diana J
Bought by
Calderon Roberto and Calderon Adita
Current Estimated Value
Home Financials for this Owner
Home Financials are based on the most recent Mortgage that was taken out on this home.
Original Mortgage
$644,000
Outstanding Balance
$565,032
Interest Rate
4.3%
Mortgage Type
New Conventional
Estimated Equity
$533,699
Purchase Details
Closed on
Aug 12, 2004
Sold by
Nevins Gerald T and Nevins Peggy J
Bought by
Sandoval John and Sandoval Diana J
Home Financials for this Owner
Home Financials are based on the most recent Mortgage that was taken out on this home.
Original Mortgage
$321,600
Interest Rate
5.37%
Mortgage Type
Purchase Money Mortgage
Create a Home Valuation Report for This Property
The Home Valuation Report is an in-depth analysis detailing your home's value as well as a comparison with similar homes in the area
Home Values in the Area
Average Home Value in this Area
Purchase History
| Date | Buyer | Sale Price | Title Company |
|---|---|---|---|
| Calderon Roberto | $805,000 | Old Republic Title Company | |
| Sandoval John | $536,000 | First American Title Company |
Source: Public Records
Mortgage History
| Date | Status | Borrower | Loan Amount |
|---|---|---|---|
| Open | Calderon Roberto | $644,000 | |
| Previous Owner | Sandoval John | $321,600 |
Source: Public Records
Tax History Compared to Growth
Tax History
| Year | Tax Paid | Tax Assessment Tax Assessment Total Assessment is a certain percentage of the fair market value that is determined by local assessors to be the total taxable value of land and additions on the property. | Land | Improvement |
|---|---|---|---|---|
| 2025 | $10,825 | $897,989 | $493,839 | $404,150 |
| 2024 | $10,825 | $880,382 | $484,156 | $396,226 |
| 2023 | $10,760 | $863,120 | $474,663 | $388,457 |
| 2022 | $10,583 | $846,197 | $465,356 | $380,841 |
| 2021 | $10,536 | $829,606 | $456,232 | $373,374 |
| 2020 | $10,420 | $821,100 | $451,554 | $369,546 |
| 2019 | $8,594 | $669,755 | $374,865 | $294,890 |
| 2018 | $8,022 | $656,623 | $367,515 | $289,108 |
| 2017 | $8,191 | $643,749 | $360,309 | $283,440 |
| 2016 | $8,026 | $631,128 | $353,245 | $277,883 |
| 2015 | $7,571 | $621,648 | $347,939 | $273,709 |
| 2014 | $7,523 | $609,472 | $341,124 | $268,348 |
Source: Public Records
Map
Nearby Homes
- 895 Greenwich Dr
- 7210 Yorktown Dr
- 7035 Yorktown Dr
- 775 Williamsburg Way Unit B
- 771 Williamsburg Way Unit C
- 773 Gettysburg Way
- 7245 Trenton Place
- 738 Gettysburg Way
- 7305 Chadwick St
- 7363 Ailes Ct Unit Homesite 5
- 7352 Ailes Ct Unit Homesite 7
- 7379 Ailes Ct Unit Homesite 3
- 7360 Ailes Ct Unit Homesite 8
- 7343 Princevalle St Unit Homesite 19
- Plan 2 at Heritage on 6th Street
- Plan 1 at Heritage on 6th Street
- 7351 Princevalle St Unit Homesite 18
- 7376 Ailes Ct Unit Homesite 10
- 7359 Princevalle St Unit Homesite 17
- 7391 Princevalle St Unit Homesite 13
- 7120 Potomac Place
- 885 Dearborn Place
- 890 Dearborn Place
- 7110 Potomac Place
- 900 Dearborn Place
- 7130 Potomac Place
- 875 Dearborn Place
- 880 Dearborn Place
- 7140 Potomac Place
- 865 Dearborn Place
- 870 Dearborn Place
- 7100 Potomac Place
- 885 Chesapeake Place
- 890 Plymouth Dr
- 875 Chesapeake Place
- 895 Chesapeake Place
- 7150 Potomac Place
- 855 Dearborn Place
- 880 Plymouth Dr
- 865 Chesapeake Place