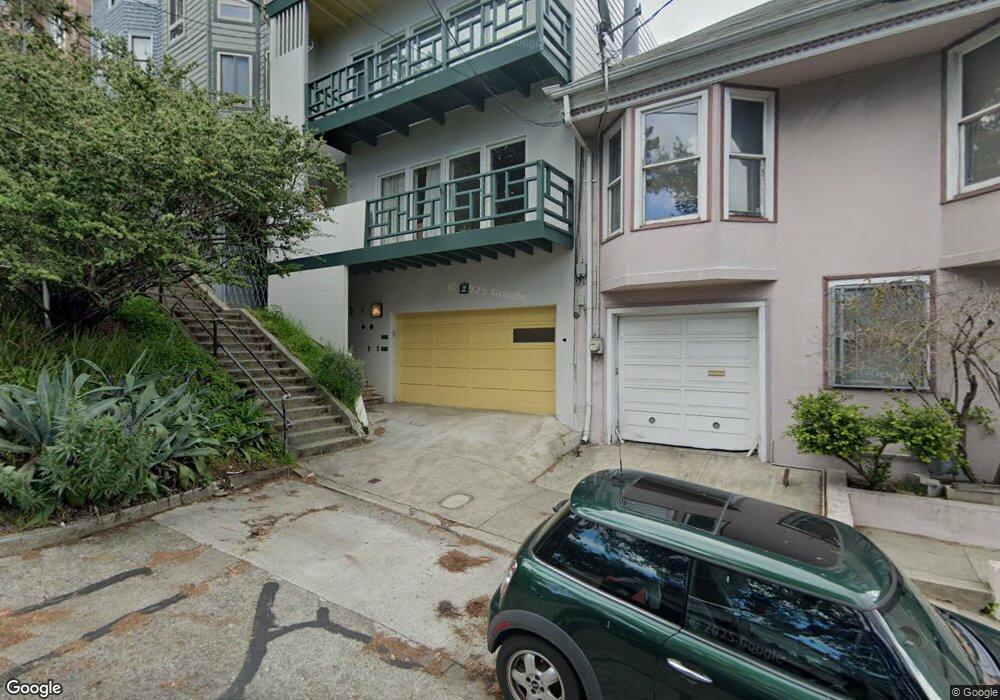
895 Vermont St Unit 897 San Francisco, CA 94107
Potrero NeighborhoodEstimated Value: $1,389,000 - $1,819,000
--
Bed
2
Baths
2,112
Sq Ft
$774/Sq Ft
Est. Value
About This Home
This home is located at 895 Vermont St Unit 897, San Francisco, CA 94107 and is currently estimated at $1,635,145, approximately $774 per square foot. 895 Vermont St Unit 897 is a home located in San Francisco County with nearby schools including Thomas Starr King Elementary School, Aptos Middle School, and Creative Arts Charter School.
Ownership History
Date
Name
Owned For
Owner Type
Purchase Details
Closed on
Dec 9, 2015
Sold by
Kong Luz E and Kong Luz Elizabeth
Bought by
Kong Luz E
Current Estimated Value
Purchase Details
Closed on
Oct 6, 2015
Sold by
Kong Manuel and Kong Ana
Bought by
Kong Family Trust
Purchase Details
Closed on
Dec 2, 2002
Sold by
Kong Ana R
Bought by
Kong Manauel E
Home Financials for this Owner
Home Financials are based on the most recent Mortgage that was taken out on this home.
Original Mortgage
$260,000
Interest Rate
6.28%
Mortgage Type
Commercial
Purchase Details
Closed on
Aug 1, 2001
Sold by
Kong Jose L and Kong Manuel E
Bought by
Kong Manuel E and Kong Ana R
Home Financials for this Owner
Home Financials are based on the most recent Mortgage that was taken out on this home.
Original Mortgage
$260,000
Interest Rate
7.1%
Mortgage Type
Commercial
Create a Home Valuation Report for This Property
The Home Valuation Report is an in-depth analysis detailing your home's value as well as a comparison with similar homes in the area
Home Values in the Area
Average Home Value in this Area
Purchase History
| Date | Buyer | Sale Price | Title Company |
|---|---|---|---|
| Kong Luz E | -- | None Available | |
| Kong Family Trust | -- | None Available | |
| Kong Manauel E | -- | Old Republic Title Company | |
| Kong Manuel E | -- | Old Republic Title Company | |
| Kong Luz Elizabeth | -- | Old Republic Title Company |
Source: Public Records
Mortgage History
| Date | Status | Borrower | Loan Amount |
|---|---|---|---|
| Closed | Kong Manauel E | $260,000 | |
| Closed | Kong Manuel E | $260,000 |
Source: Public Records
Tax History Compared to Growth
Tax History
| Year | Tax Paid | Tax Assessment Tax Assessment Total Assessment is a certain percentage of the fair market value that is determined by local assessors to be the total taxable value of land and additions on the property. | Land | Improvement |
|---|---|---|---|---|
| 2025 | $9,137 | $708,247 | $275,931 | $432,316 |
| 2024 | $9,137 | $694,361 | $270,521 | $423,840 |
| 2023 | $8,903 | $680,748 | $265,218 | $415,530 |
| 2022 | $8,710 | $667,402 | $260,018 | $407,384 |
| 2021 | $8,555 | $654,317 | $254,920 | $399,397 |
| 2020 | $8,705 | $647,609 | $252,307 | $395,302 |
| 2019 | $8,417 | $634,913 | $247,361 | $387,552 |
| 2018 | $8,132 | $622,466 | $242,512 | $379,954 |
| 2017 | $7,740 | $610,263 | $237,758 | $372,505 |
| 2016 | $7,591 | $598,299 | $233,097 | $365,202 |
| 2015 | $7,493 | $589,314 | $229,597 | $359,717 |
| 2014 | $7,299 | $577,773 | $225,101 | $352,672 |
Source: Public Records
Map
Nearby Homes
- 2119 22nd St
- 1002 Rhode Island St Unit 1
- 2023 22nd St
- 700 De Haro St
- 666 Carolina St Unit 666
- 1812 20th St
- 631 Carolina St
- 701 Hampshire St Unit 5
- 2225 23rd St Unit 214
- 2703 21st St
- 2712 21st St
- 2625 19th St
- 1225 Rhode Island St
- 1206-1208 Utah St
- 2250 24th St Unit 127
- 2603 23rd St
- 2758 23rd St
- 2758-2760 23rd St
- 2225 Mariposa St
- 2125 Bryant St Unit 403
- 889 Vermont St
- 891 Vermont St Unit 891
- 901 Vermont St
- 885 Vermont St Unit 887
- 905 Vermont St
- 875 Vermont St Unit 201
- 875 Vermont St Unit 105
- 875 Vermont St Unit 202/7
- 875 Vermont St
- 875 Vermont St Unit 103
- 875 Vermont St Unit 6
- 875 Vermont St Unit 5
- 875 Vermont St Unit 3
- 875 Vermont St Unit 300
- 875 Vermont St Unit 204
- 875 Vermont St Unit 9
- 875 Vermont St Unit 203
- 875 Vermont St Unit 202
- 875 Vermont St Unit 4
- 875 Vermont St Unit 2