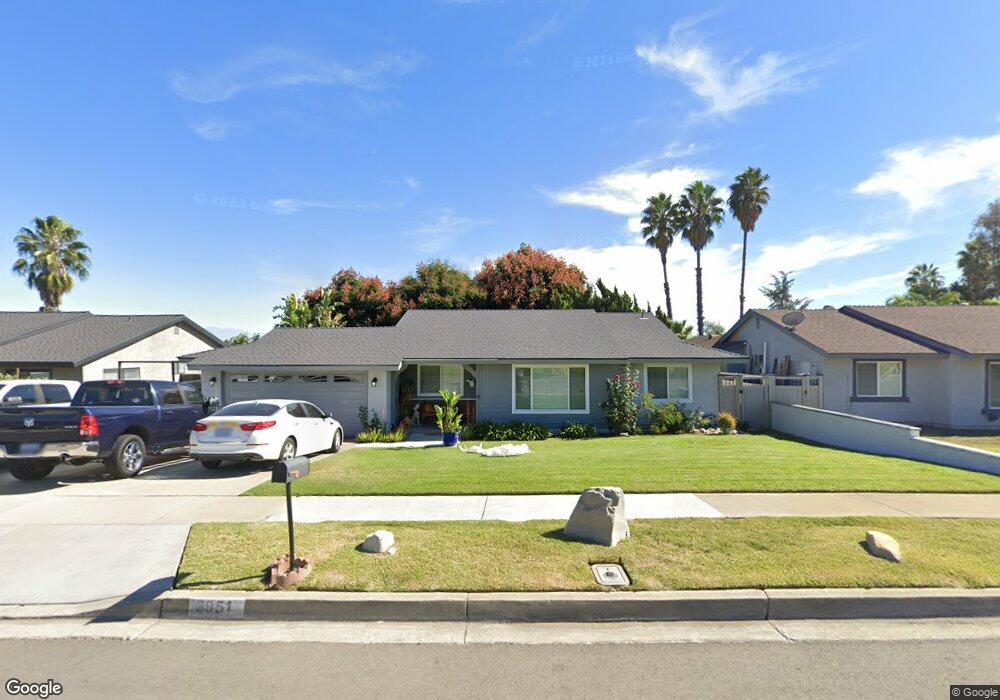
8951 Hemlock St Rancho Cucamonga, CA 91730
Estimated Value: $673,543 - $703,000
3
Beds
2
Baths
1,244
Sq Ft
$557/Sq Ft
Est. Value
About This Home
This home is located at 8951 Hemlock St, Rancho Cucamonga, CA 91730 and is currently estimated at $692,636, approximately $556 per square foot. 8951 Hemlock St is a home located in San Bernardino County with nearby schools including Valle Vista Elementary School, Cucamonga Middle School, and Alta Loma High School.
Ownership History
Date
Name
Owned For
Owner Type
Purchase Details
Closed on
Aug 13, 2025
Sold by
White Family Trust and White Clifford Dale
Bought by
White Family Trust and White
Current Estimated Value
Home Financials for this Owner
Home Financials are based on the most recent Mortgage that was taken out on this home.
Original Mortgage
$250,000
Outstanding Balance
$249,783
Interest Rate
6.72%
Mortgage Type
Credit Line Revolving
Estimated Equity
$442,853
Purchase Details
Closed on
Nov 3, 2024
Sold by
White Clifford D and Castro-White Linda
Bought by
White Family Trust and White
Purchase Details
Closed on
Mar 5, 2004
Sold by
White Clifford D
Bought by
White Clifford D and White Linda Castro
Home Financials for this Owner
Home Financials are based on the most recent Mortgage that was taken out on this home.
Original Mortgage
$180,082
Interest Rate
5.65%
Mortgage Type
New Conventional
Create a Home Valuation Report for This Property
The Home Valuation Report is an in-depth analysis detailing your home's value as well as a comparison with similar homes in the area
Purchase History
| Date | Buyer | Sale Price | Title Company |
|---|---|---|---|
| White Family Trust | -- | First American Title | |
| White Family Trust | -- | None Listed On Document | |
| White Family Trust | -- | None Listed On Document | |
| White Clifford D | -- | Stewart Title Company |
Source: Public Records
Mortgage History
| Date | Status | Borrower | Loan Amount |
|---|---|---|---|
| Open | White Family Trust | $250,000 | |
| Previous Owner | White Clifford D | $180,082 |
Source: Public Records
Tax History
| Year | Tax Paid | Tax Assessment Tax Assessment Total Assessment is a certain percentage of the fair market value that is determined by local assessors to be the total taxable value of land and additions on the property. | Land | Improvement |
|---|---|---|---|---|
| 2025 | $2,290 | $202,408 | $70,844 | $131,564 |
| 2024 | $2,230 | $198,439 | $69,455 | $128,984 |
| 2023 | $2,182 | $194,548 | $68,093 | $126,455 |
| 2022 | $2,147 | $190,733 | $66,758 | $123,975 |
| 2021 | $2,147 | $186,993 | $65,449 | $121,544 |
| 2020 | $2,086 | $185,076 | $64,778 | $120,298 |
| 2019 | $2,077 | $181,447 | $63,508 | $117,939 |
| 2018 | $2,019 | $177,889 | $62,263 | $115,626 |
| 2017 | $1,983 | $174,401 | $61,042 | $113,359 |
| 2016 | $1,960 | $170,981 | $59,845 | $111,136 |
| 2015 | $1,939 | $168,413 | $58,946 | $109,467 |
| 2014 | $1,884 | $165,114 | $57,791 | $107,323 |
Source: Public Records
Map
Nearby Homes
- 7741 San Diego Ave
- 7731 San Diego Ave
- 0 Camino Predera Unit WS26011008
- 8825 Vineyard Ave
- 8039 City View Place
- 8041 City View Place
- 8167 Vineyard Ave Unit 8
- 7548 Pepper St
- 7910 Onyx Ct
- 9364 Langston St
- 7921 Onyx Ct
- 9340 Foothill Blvd Unit 68
- 9340 Foothill Blvd
- 9425 San Bernardino Rd
- 8048 Tulsa Place Unit 105
- 8651 Foothill Blvd Unit 99
- 8651 Foothill Blvd Unit 82
- 8651 Foothill Blvd Unit 157
- 8651 Foothill Blvd Unit 140
- 8651 Foothill Blvd Unit 63
- 8961 Hemlock St
- 8937 Hemlock St
- 9012 Chianti Ct
- 8927 Hemlock St
- 9007 Chianti Ct
- 8950 Hemlock St
- 8938 Hemlock St
- 7854 Winery Ridge Dr
- 8960 Hemlock St
- 9032 Chianti Ct
- 9017 Chianti Ct
- 8981 Hemlock St
- 8926 Hemlock St
- 8917 Hemlock St
- 7844 Winery Ridge Dr
- 7923 Summerlin Place
- 9027 Chianti Ct
- 7809 Hickory Cir
- 7825 Hickory Cir
- 8916 Hemlock St
Your Personal Tour Guide
Ask me questions while you tour the home.