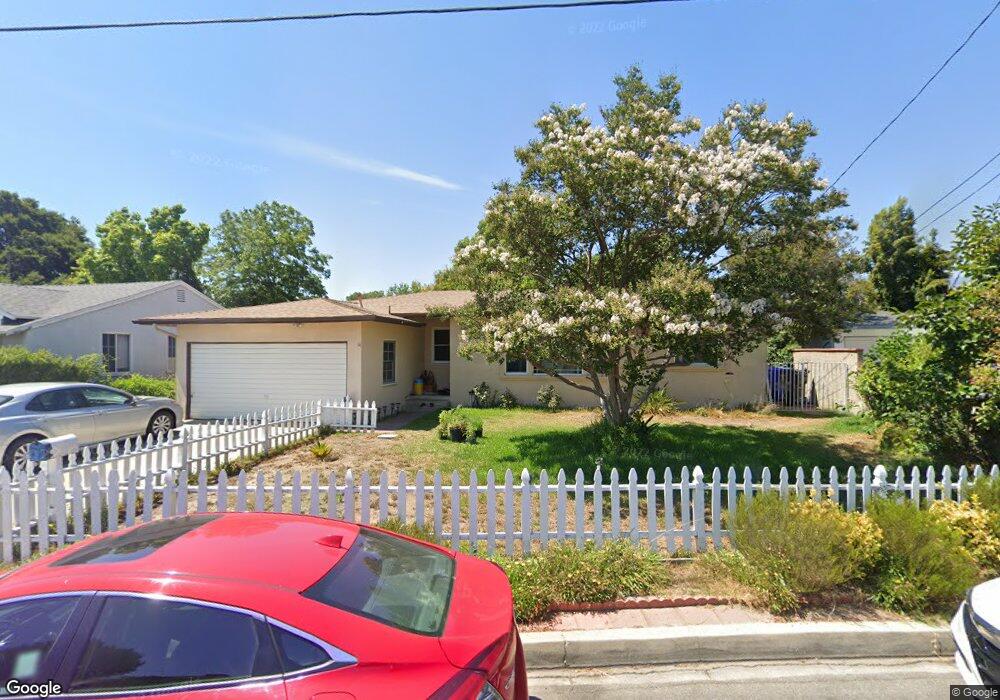
8955 Callita St San Gabriel, CA 91775
Estimated Value: $986,000 - $1,337,000
3
Beds
2
Baths
1,702
Sq Ft
$694/Sq Ft
Est. Value
About This Home
This home is located at 8955 Callita St, San Gabriel, CA 91775 and is currently estimated at $1,181,833, approximately $694 per square foot. 8955 Callita St is a home located in Los Angeles County with nearby schools including Emperor Elementary School, Oak Avenue Intermediate School, and Temple City High School.
Ownership History
Date
Name
Owned For
Owner Type
Purchase Details
Closed on
Feb 22, 2021
Sold by
Liu Zheng and Liu Xin
Bought by
Liu-Sheng Family Trust and Liu
Current Estimated Value
Purchase Details
Closed on
Dec 28, 2004
Sold by
Cobb John Joseph
Bought by
Liu Zheng and Sheng Xin
Home Financials for this Owner
Home Financials are based on the most recent Mortgage that was taken out on this home.
Original Mortgage
$421,500
Interest Rate
5.73%
Mortgage Type
Purchase Money Mortgage
Purchase Details
Closed on
Jul 21, 1999
Sold by
Burgess Robert L
Bought by
Cobb John Joseph
Create a Home Valuation Report for This Property
The Home Valuation Report is an in-depth analysis detailing your home's value as well as a comparison with similar homes in the area
Home Values in the Area
Average Home Value in this Area
Purchase History
| Date | Buyer | Sale Price | Title Company |
|---|---|---|---|
| Liu-Sheng Family Trust | -- | None Listed On Document | |
| Liu Zheng | $535,000 | North American Title Co | |
| Cobb John Joseph | $245,000 | Equity Title Company |
Source: Public Records
Mortgage History
| Date | Status | Borrower | Loan Amount |
|---|---|---|---|
| Previous Owner | Liu Zheng | $421,500 | |
| Closed | Liu Zheng | $60,000 |
Source: Public Records
Tax History Compared to Growth
Tax History
| Year | Tax Paid | Tax Assessment Tax Assessment Total Assessment is a certain percentage of the fair market value that is determined by local assessors to be the total taxable value of land and additions on the property. | Land | Improvement |
|---|---|---|---|---|
| 2025 | $8,781 | $745,725 | $541,947 | $203,778 |
| 2024 | $8,781 | $731,104 | $531,321 | $199,783 |
| 2023 | $8,580 | $716,769 | $520,903 | $195,866 |
| 2022 | $8,027 | $702,716 | $510,690 | $192,026 |
| 2021 | $8,172 | $688,938 | $500,677 | $188,261 |
| 2020 | $8,057 | $681,875 | $495,544 | $186,331 |
| 2019 | $7,877 | $668,506 | $485,828 | $182,678 |
| 2018 | $7,694 | $655,399 | $476,302 | $179,097 |
| 2016 | $7,370 | $629,951 | $457,807 | $172,144 |
| 2015 | $7,244 | $620,490 | $450,931 | $169,559 |
| 2014 | $7,134 | $608,336 | $442,098 | $166,238 |
Source: Public Records
Map
Nearby Homes
- 8939 Emperor Ave
- 6352 N Muscatel Ave
- 8847 Naomi Ave
- 6812 Sultana Ave
- 6628 N Muscatel Ave
- 8938 Duarte Rd
- 6356 Lemon Ave
- 6227 Sultana Ave
- 6159 Rosemead Blvd
- 6770 Oak Ave
- 8533 Los Olivos Dr
- 6839 Oak Ave
- 6137 Rosemead Blvd
- 9103 Duarte Rd
- 8516 Callita St
- 6430 N Vista St
- 6138 Avon Ave
- 6204 Oak Ave
- 8930 E Fairview Ave
- 1161 W Duarte Rd Unit 3
- 8947 Callita St
- 8963 Callita St
- 8941 Callita St
- 8952 Callita St
- 6617 Sultana Ave
- 8937 Callita St
- 8946 Callita St
- 8971 Callita St
- 6615 Sultana Ave
- 8940 Callita St
- 8954 Camino Real
- 8958 Camino Real
- 8931 Callita St
- 6539 Rosemead Blvd
- 8934 Callita St
- 8928 Camino Real
- 6629 Sultana Ave
- 8930 Callita St
- 8953 Camino Real
- 8925 Callita St