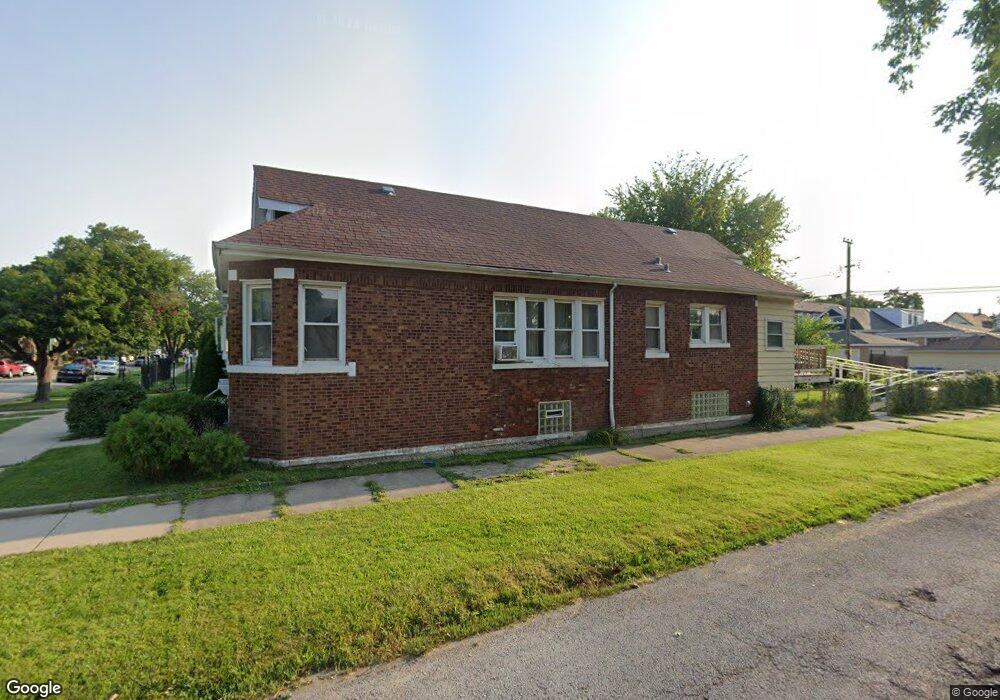
8957 S Union Ave Chicago, IL 60620
Auburn Gresham NeighborhoodEstimated Value: $140,000 - $246,000
3
Beds
1
Bath
1,657
Sq Ft
$115/Sq Ft
Est. Value
About This Home
This home is located at 8957 S Union Ave, Chicago, IL 60620 and is currently estimated at $191,050, approximately $115 per square foot. 8957 S Union Ave is a home located in Cook County with nearby schools including Ryder Elementary Math & Sci Spec School, Harlan Community Academy High School, and Hansberry College Prep.
Ownership History
Date
Name
Owned For
Owner Type
Purchase Details
Closed on
Oct 31, 2024
Sold by
Crews Sarah
Bought by
Whitfield Larry
Current Estimated Value
Home Financials for this Owner
Home Financials are based on the most recent Mortgage that was taken out on this home.
Original Mortgage
$114,000
Outstanding Balance
$112,881
Interest Rate
8%
Mortgage Type
New Conventional
Estimated Equity
$78,169
Purchase Details
Closed on
Apr 16, 2003
Sold by
Suburban Bank & Trust Co
Bought by
Crews Sarah
Home Financials for this Owner
Home Financials are based on the most recent Mortgage that was taken out on this home.
Original Mortgage
$118,047
Interest Rate
6.02%
Mortgage Type
FHA
Purchase Details
Closed on
Feb 3, 2003
Sold by
Feltz Ronald
Bought by
Suburban Bank & Trust and Trust #74-2875
Purchase Details
Closed on
Jan 28, 2003
Sold by
Bank One Financial
Bought by
Feltz Ronald
Purchase Details
Closed on
Nov 1, 2002
Sold by
Simon
Bought by
Bank One Financial
Create a Home Valuation Report for This Property
The Home Valuation Report is an in-depth analysis detailing your home's value as well as a comparison with similar homes in the area
Home Values in the Area
Average Home Value in this Area
Purchase History
| Date | Buyer | Sale Price | Title Company |
|---|---|---|---|
| Whitfield Larry | $142,500 | Old Republic Title | |
| Whitfield Larry | $142,500 | Old Republic Title | |
| Crews Sarah | $120,000 | -- | |
| Crews Sarah | $120,000 | -- | |
| Crews Sarah | $120,000 | -- | |
| Crews Sarah | $120,000 | -- | |
| Suburban Bank & Trust | -- | -- | |
| Suburban Bank & Trust | -- | -- | |
| Feltz Ronald | $40,000 | -- | |
| Feltz Ronald | $40,000 | -- | |
| Bank One Financial | -- | -- | |
| Bank One Financial | -- | -- |
Source: Public Records
Mortgage History
| Date | Status | Borrower | Loan Amount |
|---|---|---|---|
| Open | Whitfield Larry | $114,000 | |
| Previous Owner | Crews Sarah | $118,047 |
Source: Public Records
Tax History
| Year | Tax Paid | Tax Assessment Tax Assessment Total Assessment is a certain percentage of the fair market value that is determined by local assessors to be the total taxable value of land and additions on the property. | Land | Improvement |
|---|---|---|---|---|
| 2025 | $2,260 | $13,001 | $2,993 | $10,008 |
| 2024 | $2,260 | $13,001 | $2,993 | $10,008 |
| 2023 | $2,182 | $14,001 | $2,363 | $11,638 |
| 2022 | $2,182 | $14,001 | $2,363 | $11,638 |
| 2021 | $2,151 | $13,999 | $2,362 | $11,637 |
| 2020 | $1,211 | $8,523 | $2,362 | $6,161 |
| 2019 | $1,196 | $9,366 | $2,362 | $7,004 |
| 2018 | $1,174 | $9,366 | $2,362 | $7,004 |
| 2017 | $2,097 | $13,095 | $2,047 | $11,048 |
| 2016 | $2,128 | $13,095 | $2,047 | $11,048 |
| 2015 | $1,924 | $13,095 | $2,047 | $11,048 |
| 2014 | $1,947 | $13,036 | $1,890 | $11,146 |
| 2013 | $1,897 | $13,036 | $1,890 | $11,146 |
Source: Public Records
Map
Nearby Homes
- 8853 S Halsted St
- 9100 S Emerald Ave
- 9100 S Wallace St
- 8856 S Parnell Ave
- 8816 S Union Ave
- 9118 S Wallace St
- 9117 S Wallace St
- 8851 S Parnell Ave
- 8900 S Normal Ave
- 9115 S Green St
- 9019 S Normal Ave
- 9207 S Halsted St
- 8948 S Vincennes Ave
- 9146 S Eggleston Ave
- 738 W 87th St
- 8633 S Union Ave
- 9254 S Parnell Ave
- 9238 S Normal Ave
- 9240 S Normal Ave
- 8616 S Emerald Ave
- 8953 S Union Ave
- 8955 S Union Ave
- 8951 S Union Ave
- 8949 S Union Ave
- 9001 S Union Ave
- 8947 S Union Ave
- 9003 S Union Ave
- 8943 S Union Ave
- 8941 S Union Ave
- 8956 S Lowe Ave
- 8952 S Lowe Ave
- 9007 S Union Ave
- 8952 S Union Ave
- 8950 S Lowe Ave
- 8950 S Union Ave
- 8939 S Union Ave
- 8948 S Lowe Ave
- 8948 S Union Ave
- 9000 S Lowe Ave
- 9000 S Union Ave
Your Personal Tour Guide
Ask me questions while you tour the home.