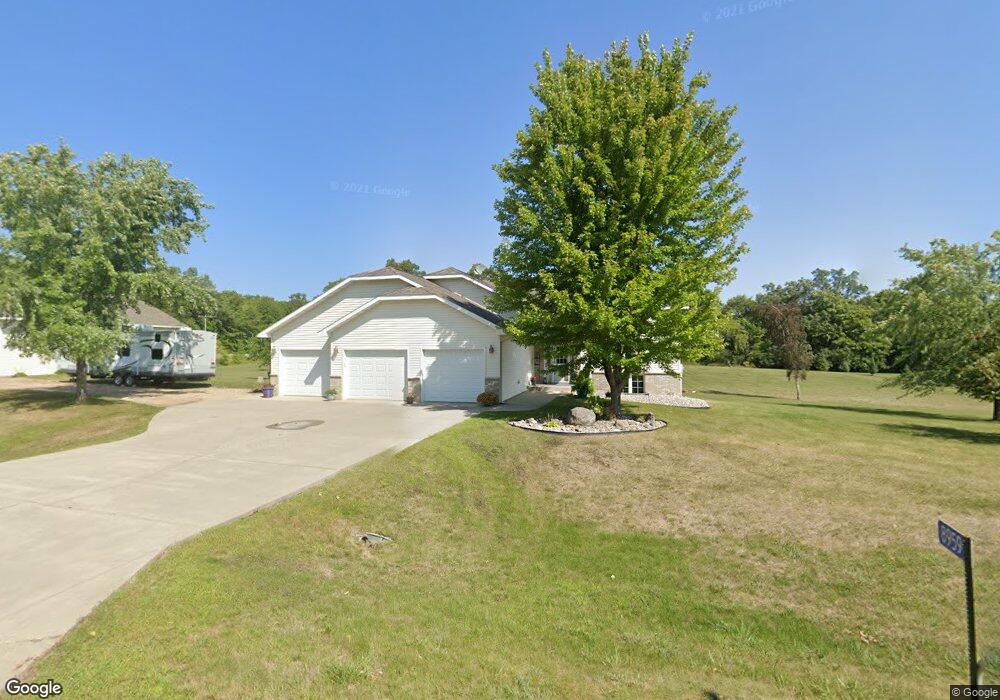
8959 8959 Sw Spearfish Alexandria, MN 56308
Estimated Value: $484,000 - $544,433
5
Beds
2
Baths
2,658
Sq Ft
$196/Sq Ft
Est. Value
About This Home
This home is located at 8959 8959 Sw Spearfish, Alexandria, MN 56308 and is currently estimated at $521,608, approximately $196 per square foot. 8959 8959 Sw Spearfish is a home located in Douglas County with nearby schools including Lincoln Elementary School, Discovery Middle School, and Alexandria Area High School.
Ownership History
Date
Name
Owned For
Owner Type
Purchase Details
Closed on
May 16, 2008
Sold by
Federal Home Loan Mortgage Corporation
Bought by
Helmbrechi Ryan and Helmbrechi Kelly
Current Estimated Value
Home Financials for this Owner
Home Financials are based on the most recent Mortgage that was taken out on this home.
Original Mortgage
$169,600
Outstanding Balance
$107,687
Interest Rate
5.93%
Mortgage Type
New Conventional
Estimated Equity
$413,921
Purchase Details
Closed on
Mar 5, 2008
Sold by
Wells Fargo Bank Na
Bought by
Federal Home Loan Mortgage Corporation
Purchase Details
Closed on
Apr 29, 2005
Sold by
Gardeabn Builders Llc
Bought by
Rustom Gerald R and Rustom Jennifer A
Home Financials for this Owner
Home Financials are based on the most recent Mortgage that was taken out on this home.
Original Mortgage
$227,050
Interest Rate
6.06%
Mortgage Type
New Conventional
Create a Home Valuation Report for This Property
The Home Valuation Report is an in-depth analysis detailing your home's value as well as a comparison with similar homes in the area
Home Values in the Area
Average Home Value in this Area
Purchase History
| Date | Buyer | Sale Price | Title Company |
|---|---|---|---|
| Helmbrechi Ryan | -- | None Available | |
| Federal Home Loan Mortgage Corporation | -- | None Available | |
| Rustom Gerald R | $239,000 | None Available |
Source: Public Records
Mortgage History
| Date | Status | Borrower | Loan Amount |
|---|---|---|---|
| Open | Helmbrechi Ryan | $169,600 | |
| Previous Owner | Rustom Gerald R | $227,050 |
Source: Public Records
Tax History Compared to Growth
Tax History
| Year | Tax Paid | Tax Assessment Tax Assessment Total Assessment is a certain percentage of the fair market value that is determined by local assessors to be the total taxable value of land and additions on the property. | Land | Improvement |
|---|---|---|---|---|
| 2025 | $3,758 | $479,500 | $35,700 | $443,800 |
| 2024 | $3,758 | $458,500 | $35,700 | $422,800 |
| 2023 | $3,846 | $439,700 | $35,700 | $404,000 |
| 2022 | $3,476 | $384,200 | $35,700 | $348,500 |
| 2021 | $3,374 | $334,600 | $35,700 | $298,900 |
| 2020 | $3,476 | $323,700 | $35,700 | $288,000 |
| 2019 | $2,928 | $313,200 | $35,700 | $277,500 |
| 2018 | $2,796 | $298,100 | $35,700 | $262,400 |
| 2017 | $2,466 | $286,000 | $35,700 | $250,300 |
| 2016 | $2,564 | $252,200 | $34,629 | $217,571 |
| 2015 | $2,504 | $0 | $0 | $0 |
| 2014 | -- | $245,200 | $35,700 | $209,500 |
Source: Public Records
Map
Nearby Homes
- Lot 18 Hummingbird Ln SW
- Lot 16 Hummingbird Ln SW
- Lot 14 Hummingbird Ln SW
- Lots 9 & 10 Hummingbird Ln SW
- Lot 17 Hummingbird Ln SW
- 7443 Walleye Ln SW
- 7755 Canary Rd SW
- 9630 Rachel Shores SW
- 5023 W Lake Mary Dr SW
- 12926 Daisy Ln SW
- xxxx Woodsmen Ln SW
- 8951 Twin Point Rd SW Unit 69
- 2012 Brandt's Beach Ct
- 6070 Fern Ln SW
- 7687 Lindgren Way SW
- TBD County Road 7 SW
- XXX County Road 7 SW
- XXX Loon Point Dr
- TBD Valley Ln SW
- 3035 County Road 4 SW
- 8959 Spearfish Ln SW
- 8509 State Highway 114 SW
- 8863 Spearfish Ln SW
- 8894 Spearfish Ln SW
- Lots 3&4 Spearfish Ln
- xxx Spearfish Ln
- xxxxx Spearfish Ln
- xxxx Spearfish Ln
- XXXX Spearfish Ln
- Lots 1&2 Spearfish Ln
- Lot 1&2 Spearfish Ln
- 8850 Spearfish Ln SW
- 0 Lot 5 Spearfish Ln Unit 3563275
- 0 Lot 5 Spearfish Ln Unit 4373144
- 8510 State Highway 114 SW
- 8776 State Highway 114 SW
- Lots 3 & 4 Spearfish Ln SW
- 8923 Minnesota 114
- 8700 Spearfish Ln SW
- 8353 State Highway 114 SW