895B Dean Patrick Rd Locust Grove, GA 30248
Butts County NeighborhoodEstimated Value: $172,000 - $201,000
--
Bed
2
Baths
1,244
Sq Ft
$150/Sq Ft
Est. Value
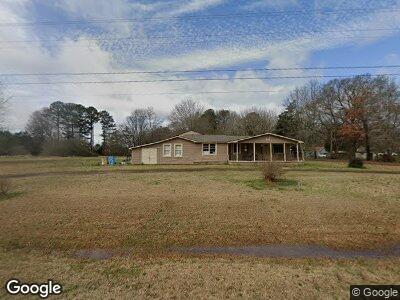
About This Home
This home is located at 895B Dean Patrick Rd, Locust Grove, GA 30248 and is currently estimated at $186,973, approximately $150 per square foot. 895B Dean Patrick Rd is a home located in Butts County with nearby schools including Jackson High School.
Ownership History
Date
Name
Owned For
Owner Type
Purchase Details
Closed on
Aug 2, 2024
Sold by
Hodges Cherie
Bought by
Gonzalex Macias Jose and Macias Jose Gonzalex
Current Estimated Value
Home Financials for this Owner
Home Financials are based on the most recent Mortgage that was taken out on this home.
Original Mortgage
$184,594
Outstanding Balance
$183,977
Interest Rate
6.95%
Mortgage Type
New Conventional
Estimated Equity
$17,520
Purchase Details
Closed on
Apr 12, 2022
Sold by
Parker Katheryn R
Bought by
Hodges Jordan Tyler
Home Financials for this Owner
Home Financials are based on the most recent Mortgage that was taken out on this home.
Original Mortgage
$166,565
Interest Rate
3.76%
Mortgage Type
New Conventional
Purchase Details
Closed on
Mar 25, 2016
Sold by
Allen Rebecca D
Bought by
Parker Kathrun R
Purchase Details
Closed on
Dec 31, 2009
Sold by
Daniels Clyde
Bought by
Allen Rebecca D
Create a Home Valuation Report for This Property
The Home Valuation Report is an in-depth analysis detailing your home's value as well as a comparison with similar homes in the area
Home Values in the Area
Average Home Value in this Area
Purchase History
| Date | Buyer | Sale Price | Title Company |
|---|---|---|---|
| Gonzalex Macias Jose | $188,000 | -- | |
| Hodges Jordan Tyler | $164,900 | -- | |
| Parker Kathrun R | -- | -- | |
| Allen Rebecca D | -- | -- | |
| Daniels Sybil J | -- | -- | |
| Allen Rebecca D | -- | -- | |
| Daniels Sybil J | -- | -- |
Source: Public Records
Mortgage History
| Date | Status | Borrower | Loan Amount |
|---|---|---|---|
| Open | Gonzalex Macias Jose | $184,594 | |
| Previous Owner | Hodges Jordan Tyler | $166,565 | |
| Previous Owner | Parker Kathryn R | $25,000 |
Source: Public Records
Tax History Compared to Growth
Tax History
| Year | Tax Paid | Tax Assessment Tax Assessment Total Assessment is a certain percentage of the fair market value that is determined by local assessors to be the total taxable value of land and additions on the property. | Land | Improvement |
|---|---|---|---|---|
| 2024 | $1,368 | $56,664 | $3,400 | $53,264 |
| 2023 | $1,368 | $52,655 | $3,400 | $49,255 |
| 2022 | $838 | $40,614 | $4,664 | $35,950 |
| 2021 | $777 | $36,465 | $4,664 | $31,801 |
| 2020 | $497 | $26,285 | $4,664 | $21,621 |
| 2019 | $465 | $25,956 | $4,664 | $21,292 |
| 2018 | $384 | $22,840 | $4,664 | $18,176 |
| 2017 | $593 | $21,158 | $4,664 | $16,494 |
| 2016 | $672 | $21,158 | $4,664 | $16,494 |
| 2015 | $668 | $21,158 | $4,664 | $16,494 |
| 2014 | $671 | $20,103 | $4,664 | $15,439 |
Source: Public Records
Map
Nearby Homes
- 927 Dean Patrick Rd
- 234 Linford Dr
- 331A County Line Rd
- 301 S Singley Dr
- 0 S Singley Dr Unit 10432966
- 417 Bell Flower Trail
- 615 Grove Pointe Way Unit 2
- 0 Georgia 42
- 718 Grove Pointe Cir
- 128 Astilbe Meadow Dr
- 625 Locust Rd
- 401 Grove Pointe Ct
- 112 High Meadows Trail
- 625 Kimberwick Dr
- 616 Kimberwick Dr
- 617 Kimberwick Dr
- 449 England Chapel Rd
- 673 England Chapel Rd
- 228 Indian Creek Rd
- 113 High Meadow Trail
- 895A Dean Patrick Rd
- 895B Dean Patrick Rd
- 895 Dean Patrick Rd
- 897 Dean Patrick Rd
- 903 Dean Patrick Rd
- 120 Deer Creek Cir
- 911 Dean Patrick Rd
- 911 Dean Patrick Rd Unit B
- 911 Dean Patrick Rd Unit A
- 911 Dean Patrick Rd Unit A
- 911 Dean Patrick Rd
- 911 Dean Patrick Rd
- 911B Dean Patrick Rd
- 0 Deer Creek Cir Unit 8502958
- 0 Deer Creek Cir Unit 8199118
- 0 Deer Creek Cir Unit 8199078
- 0 Deer Creek Cir Unit A 7465479
- 0 Deer Creek Cir
- 109 Deer Creek Cir
- 0 Deer Creek Cir Unit 2859559