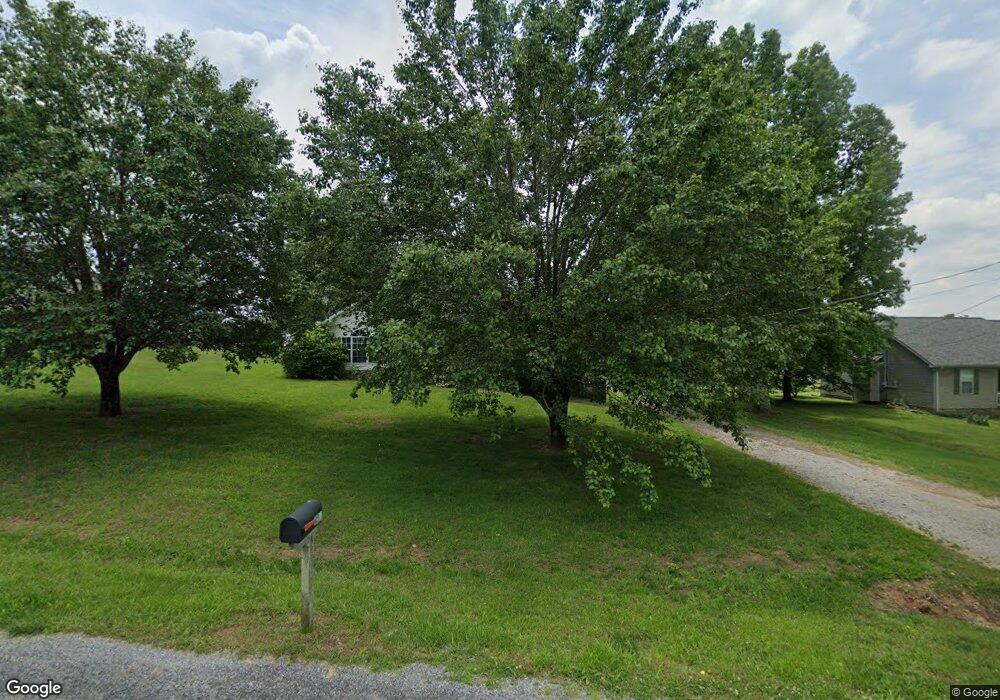
896 C Rody Rd McMinnville, TN 37110
Estimated Value: $188,566 - $264,000
--
Bed
2
Baths
1,270
Sq Ft
$187/Sq Ft
Est. Value
About This Home
This home is located at 896 C Rody Rd, McMinnville, TN 37110 and is currently estimated at $237,142, approximately $186 per square foot. 896 C Rody Rd is a home located in Warren County with nearby schools including Hickory Creek Elementary School, Warren County Middle School, and Warren County High School.
Ownership History
Date
Name
Owned For
Owner Type
Purchase Details
Closed on
Jun 22, 2024
Sold by
Marks Charlotte and Marks Chris
Bought by
Keaton Charlotte Dean
Current Estimated Value
Home Financials for this Owner
Home Financials are based on the most recent Mortgage that was taken out on this home.
Original Mortgage
$175,824
Outstanding Balance
$172,867
Interest Rate
6.25%
Mortgage Type
FHA
Estimated Equity
$64,275
Purchase Details
Closed on
Dec 2, 2003
Sold by
Roller Charlotte D
Bought by
Marks Chris and Marks Charlotte
Home Financials for this Owner
Home Financials are based on the most recent Mortgage that was taken out on this home.
Original Mortgage
$90,000
Interest Rate
6.04%
Purchase Details
Closed on
Sep 17, 1993
Bought by
Roller Charlotte D
Purchase Details
Closed on
Dec 28, 1989
Bought by
Hennessee Hennessee B and Hennessee Kathy
Create a Home Valuation Report for This Property
The Home Valuation Report is an in-depth analysis detailing your home's value as well as a comparison with similar homes in the area
Home Values in the Area
Average Home Value in this Area
Purchase History
| Date | Buyer | Sale Price | Title Company |
|---|---|---|---|
| Keaton Charlotte Dean | -- | None Listed On Document | |
| Keaton Charlotte Dean | -- | None Listed On Document | |
| Keaton Charlotte Dean | -- | None Listed On Document | |
| Marks Chris | -- | -- | |
| Roller Charlotte D | $64,000 | -- | |
| Hennessee Hennessee B | -- | -- |
Source: Public Records
Mortgage History
| Date | Status | Borrower | Loan Amount |
|---|---|---|---|
| Open | Keaton Charlotte Dean | $175,824 | |
| Closed | Keaton Charlotte Dean | $175,824 | |
| Previous Owner | Hennessee Hennessee B | $90,000 |
Source: Public Records
Tax History Compared to Growth
Tax History
| Year | Tax Paid | Tax Assessment Tax Assessment Total Assessment is a certain percentage of the fair market value that is determined by local assessors to be the total taxable value of land and additions on the property. | Land | Improvement |
|---|---|---|---|---|
| 2025 | $568 | $48,625 | $0 | $0 |
| 2024 | $568 | $28,850 | $4,125 | $24,725 |
| 2023 | $568 | $28,850 | $4,125 | $24,725 |
| 2022 | $568 | $28,850 | $4,125 | $24,725 |
| 2021 | $568 | $28,850 | $4,125 | $24,725 |
| 2020 | $451 | $28,850 | $4,125 | $24,725 |
| 2019 | $516 | $22,950 | $3,000 | $19,950 |
| 2018 | $451 | $22,950 | $3,000 | $19,950 |
| 2017 | $451 | $22,950 | $3,000 | $19,950 |
| 2016 | $451 | $22,950 | $3,000 | $19,950 |
| 2015 | $451 | $22,950 | $3,000 | $19,950 |
| 2014 | $446 | $22,950 | $3,000 | $19,950 |
| 2013 | $446 | $22,331 | $0 | $0 |
Source: Public Records
Map
Nearby Homes
- 794 C Rody Rd
- 734 C Rody Rd
- 754 C Rody Rd
- 774 C Rody Rd
- 84 Amberwood Dr
- 0 Love Rd Unit RTC3015742
- 924 Spring Valley Rd
- 0 Old Nashville Hwy Unit 240679
- 75 Cedar Crest Cir
- 88 Castle St
- 70 Castle St
- 151 Spring Valley Rd
- 308 Oak Tree Dr
- 557 Oak Tree Dr
- 3510 Bybee Branch Rd
- 381 Bethany Rd
- 115 Lakeview Trail
- 199 E Airport Dr
- 119 E Airport Dr
- 742 Laws Rd