896 Lacebark Cove Newbern, TN 38059
Estimated Value: $191,553 - $276,000
3
Beds
2
Baths
1,562
Sq Ft
$156/Sq Ft
Est. Value
About This Home
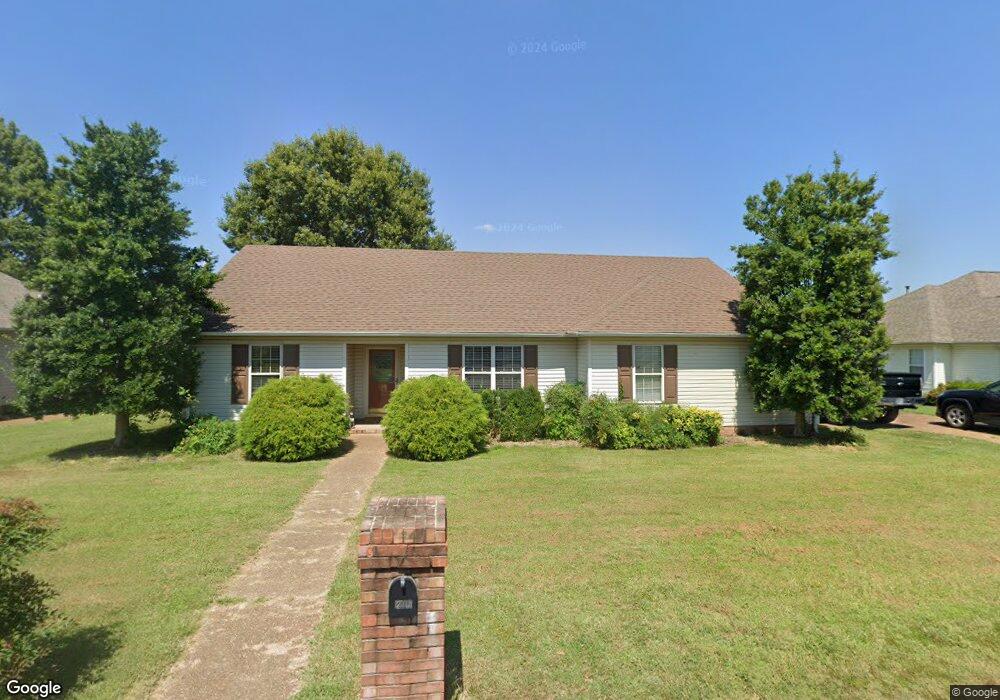
This home is located at 896 Lacebark Cove, Newbern, TN 38059 and is currently estimated at $243,888, approximately $156 per square foot. 896 Lacebark Cove is a home located in Dyer County with nearby schools including Newbern Elementary School, Northview Middle School, and Dyer County High School.
Ownership History
Date
Name
Owned For
Owner Type
Purchase Details
Closed on
Sep 21, 2016
Sold by
Pope Beth Ann
Bought by
Judd Ira J
Current Estimated Value
Home Financials for this Owner
Home Financials are based on the most recent Mortgage that was taken out on this home.
Original Mortgage
$127,300
Outstanding Balance
$101,682
Interest Rate
3.43%
Mortgage Type
New Conventional
Estimated Equity
$142,206
Purchase Details
Closed on
Aug 18, 2011
Sold by
Turner Jim L
Bought by
Pope Beth Ann
Home Financials for this Owner
Home Financials are based on the most recent Mortgage that was taken out on this home.
Original Mortgage
$119,900
Interest Rate
4.53%
Mortgage Type
Commercial
Purchase Details
Closed on
Feb 9, 1999
Sold by
Chilcutt Michael Joe and Chilcutt Tam
Bought by
Turner Jim L
Purchase Details
Closed on
Aug 10, 1998
Bought by
Chilcutt Michael Joe and Chilcutt Tammie
Create a Home Valuation Report for This Property
The Home Valuation Report is an in-depth analysis detailing your home's value as well as a comparison with similar homes in the area
Home Values in the Area
Average Home Value in this Area
Purchase History
| Date | Buyer | Sale Price | Title Company |
|---|---|---|---|
| Judd Ira J | $134,000 | -- | |
| Pope Beth Ann | $119,900 | -- | |
| Turner Jim L | $96,000 | -- | |
| Chilcutt Michael Joe | $78,000 | -- |
Source: Public Records
Mortgage History
| Date | Status | Borrower | Loan Amount |
|---|---|---|---|
| Open | Judd Ira J | $127,300 | |
| Previous Owner | Pope Beth Ann | $119,900 |
Source: Public Records
Tax History Compared to Growth
Tax History
| Year | Tax Paid | Tax Assessment Tax Assessment Total Assessment is a certain percentage of the fair market value that is determined by local assessors to be the total taxable value of land and additions on the property. | Land | Improvement |
|---|---|---|---|---|
| 2024 | $870 | $35,375 | $3,750 | $31,625 |
| 2023 | $1,335 | $35,375 | $3,750 | $31,625 |
| 2022 | $1,303 | $35,375 | $3,750 | $31,625 |
| 2021 | $1,228 | $35,375 | $3,750 | $31,625 |
| 2020 | $790 | $33,325 | $3,750 | $29,575 |
| 2019 | $1,243 | $30,075 | $3,725 | $26,350 |
| 2018 | $1,243 | $30,075 | $3,725 | $26,350 |
| 2017 | $1,243 | $30,075 | $3,725 | $26,350 |
| 2016 | $1,249 | $30,075 | $3,725 | $26,350 |
| 2015 | $1,206 | $30,075 | $3,725 | $26,350 |
| 2014 | $1,206 | $30,075 | $3,725 | $26,350 |
Source: Public Records
Map
Nearby Homes
- 891 Lacebark Cove
- 526 W Main St
- 0 Roellen Newbern Rd
- 404 W Main St
- 322 Flora Cir
- 309 N Grayson St
- 310 N Grayson St
- 610 N Grayson St
- 845 W Wind Drive Extension
- 313 Washington St
- 0 Biffle Rd
- 908 Granite Dr
- 1097 Taylor Ln
- 408 E Main St
- 404 E Johnson St
- 0 N Quincy St
- 502 E Johnson St
- 521 E Main St
- 783 Sharps Ferry Rd
- 621 E Main St
- 894 Lacebark Cove
- 898 Lacebark Cove
- 130 Pine Hill Dr
- 897 Lacebark Cove
- 899 Lacebark Cove
- 895 Lacebark Cove
- 892 Lacebark Cove
- 901 Sugar Pine Cove
- 900 Sugar Pine Cove
- 819 Williams St
- 893 Lacebark Cove
- 821 Williams St
- 896 Torrey Pine Cove
- 817 Williams St
- 894 Torrey Pine Cove
- 900 Whispering Pine Cove
- 890 Lacebark Cove
- 825 Williams St
- 898 Torrey Pine Cove
- 903 Sugar Pine Cove