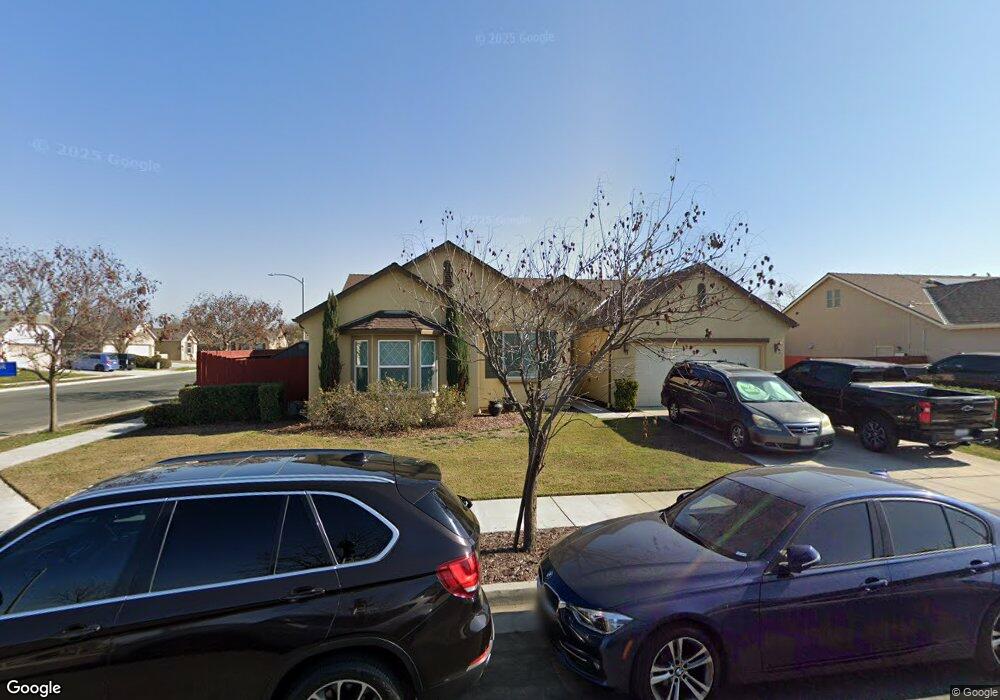
896 Legacy Dr Lemoore, CA 93245
Estimated Value: $419,024 - $445,000
5
Beds
2
Baths
1,934
Sq Ft
$224/Sq Ft
Est. Value
About This Home
This home is located at 896 Legacy Dr, Lemoore, CA 93245 and is currently estimated at $433,506, approximately $224 per square foot. 896 Legacy Dr is a home with nearby schools including Cinnamon Elementary School, Liberty Middle School, and Lemoore High School.
Ownership History
Date
Name
Owned For
Owner Type
Purchase Details
Closed on
Aug 14, 2017
Sold by
Timpa Darrell and Timpa Rebecca
Bought by
Rojas Marvin G and Rojas Barbara M
Current Estimated Value
Home Financials for this Owner
Home Financials are based on the most recent Mortgage that was taken out on this home.
Original Mortgage
$268,404
Outstanding Balance
$223,962
Interest Rate
3.96%
Mortgage Type
VA
Estimated Equity
$209,544
Purchase Details
Closed on
Nov 19, 2014
Sold by
Wathen Castanos Lemoore 872 Lp
Bought by
Timpa Darrell and Timpa Rebecca
Home Financials for this Owner
Home Financials are based on the most recent Mortgage that was taken out on this home.
Original Mortgage
$262,682
Interest Rate
3.89%
Mortgage Type
VA
Purchase Details
Closed on
Mar 26, 2009
Sold by
Lemoore Sugar Plum Llc
Bought by
Fb Holdings Llc
Create a Home Valuation Report for This Property
The Home Valuation Report is an in-depth analysis detailing your home's value as well as a comparison with similar homes in the area
Home Values in the Area
Average Home Value in this Area
Purchase History
| Date | Buyer | Sale Price | Title Company |
|---|---|---|---|
| Rojas Marvin G | $280,000 | Stewart Title Of Ca Inc | |
| Timpa Darrell | $257,500 | Old Republic Title Company | |
| Fb Holdings Llc | $1,363,000 | None Available |
Source: Public Records
Mortgage History
| Date | Status | Borrower | Loan Amount |
|---|---|---|---|
| Open | Rojas Marvin G | $268,404 | |
| Previous Owner | Timpa Darrell | $262,682 |
Source: Public Records
Tax History
| Year | Tax Paid | Tax Assessment Tax Assessment Total Assessment is a certain percentage of the fair market value that is determined by local assessors to be the total taxable value of land and additions on the property. | Land | Improvement |
|---|---|---|---|---|
| 2025 | $2,164 | $318,588 | $79,646 | $238,942 |
| 2023 | $2,164 | $306,218 | $76,554 | $229,664 |
| 2022 | $2,386 | $300,214 | $75,053 | $225,161 |
| 2021 | $3,896 | $294,329 | $73,582 | $220,747 |
| 2020 | $3,782 | $291,312 | $72,828 | $218,484 |
| 2019 | $3,749 | $285,600 | $71,400 | $214,200 |
| 2018 | $3,572 | $280,000 | $70,000 | $210,000 |
| 2017 | $3,448 | $264,330 | $62,133 | $202,197 |
| 2016 | $3,240 | $259,147 | $60,915 | $198,232 |
| 2015 | $3,155 | $255,254 | $60,000 | $195,254 |
| 2014 | $524 | $7,431 | $7,431 | $0 |
Source: Public Records
Map
Nearby Homes
- 894 Legacy Dr
- 895 Legend Dr
- 992 Tradition Dr
- 893 Legend Dr
- 998 Tradition Dr
- 982 Tradition Dr
- 897 Legacy Dr
- 895 Legacy Dr
- 1034 Tradition Dr
- 891 Legend Dr
- 890 Legacy Dr
- 972 Tradition Dr
- 891 Legacy Dr
- 1003 Boxwood Ln
- 993 Boxwood Ln
- 955 Tradition Dr
- 1013 Boxwood Ln
- 889 Legend Dr
- 983 Boxwood Ln
- 888 Legacy Dr
Your Personal Tour Guide
Ask me questions while you tour the home.