Estimated Value: $601,000 - $666,257
3
Beds
3
Baths
1,958
Sq Ft
$327/Sq Ft
Est. Value
About This Home
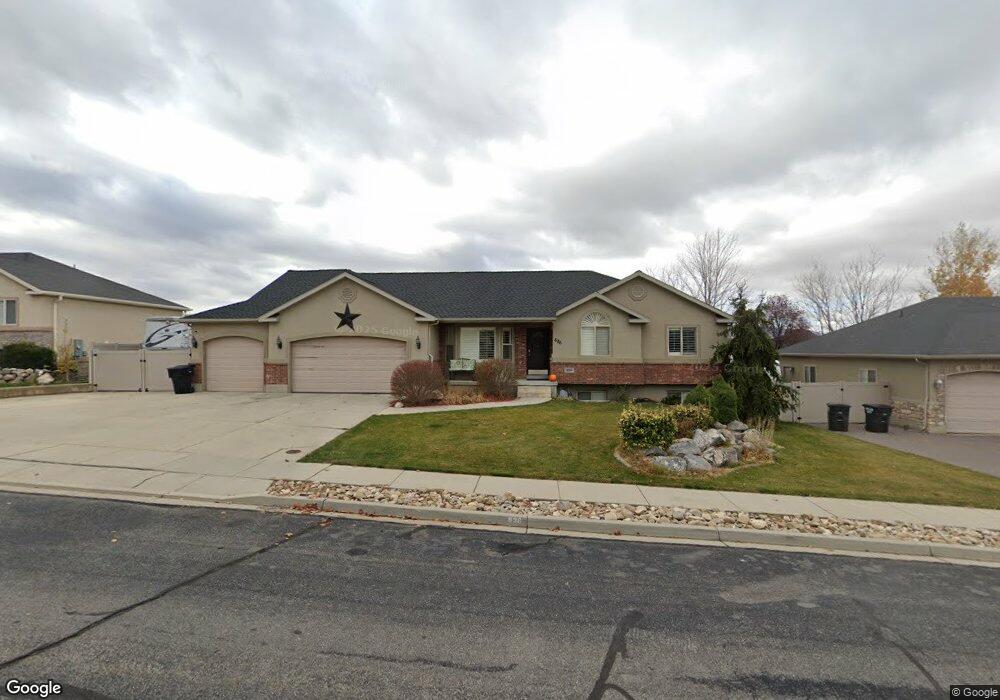
This home is located at 896 S 320 E Unit 47, Salem, UT 84653 and is currently estimated at $639,752, approximately $326 per square foot. 896 S 320 E Unit 47 is a home located in Utah County with nearby schools including Foothills Elementary School, Valley View Middle School, and Salem Junior High School.
Ownership History
Date
Name
Owned For
Owner Type
Purchase Details
Closed on
Jan 4, 2005
Sold by
Pendray Construction Inc
Bought by
Rasmussen Michael J and Rasmussen Stephenie
Current Estimated Value
Home Financials for this Owner
Home Financials are based on the most recent Mortgage that was taken out on this home.
Original Mortgage
$232,000
Outstanding Balance
$118,987
Interest Rate
5.99%
Mortgage Type
Purchase Money Mortgage
Estimated Equity
$520,765
Purchase Details
Closed on
Aug 10, 2004
Sold by
American Cover Inc
Bought by
Pendray Construction Inc
Home Financials for this Owner
Home Financials are based on the most recent Mortgage that was taken out on this home.
Original Mortgage
$156,000
Interest Rate
6.24%
Mortgage Type
Construction
Create a Home Valuation Report for This Property
The Home Valuation Report is an in-depth analysis detailing your home's value as well as a comparison with similar homes in the area
Home Values in the Area
Average Home Value in this Area
Purchase History
| Date | Buyer | Sale Price | Title Company |
|---|---|---|---|
| Rasmussen Michael J | -- | Signature Title Insurance A | |
| Pendray Construction Inc | -- | Signature Title Insurance A |
Source: Public Records
Mortgage History
| Date | Status | Borrower | Loan Amount |
|---|---|---|---|
| Open | Rasmussen Michael J | $232,000 | |
| Previous Owner | Pendray Construction Inc | $156,000 | |
| Closed | Pendray Construction Inc | $37,500 |
Source: Public Records
Tax History
| Year | Tax Paid | Tax Assessment Tax Assessment Total Assessment is a certain percentage of the fair market value that is determined by local assessors to be the total taxable value of land and additions on the property. | Land | Improvement |
|---|---|---|---|---|
| 2025 | $3,112 | $334,510 | -- | -- |
| 2024 | $3,112 | $315,590 | $0 | $0 |
| 2023 | $3,163 | $321,310 | $0 | $0 |
| 2022 | $3,309 | $331,045 | $0 | $0 |
| 2021 | $2,600 | $417,300 | $125,000 | $292,300 |
| 2020 | $2,562 | $400,200 | $113,600 | $286,600 |
| 2019 | $2,441 | $389,300 | $104,900 | $284,400 |
| 2018 | $2,554 | $389,300 | $104,900 | $284,400 |
| 2017 | $2,317 | $188,375 | $0 | $0 |
| 2016 | $2,179 | $175,120 | $0 | $0 |
| 2015 | $2,033 | $160,490 | $0 | $0 |
| 2014 | $1,799 | $142,230 | $0 | $0 |
Source: Public Records
Map
Nearby Homes
- 243 E 960 S Unit 216
- 245 E 960 S Unit 215
- 247 E 960 S Unit 214
- 1346 S 140 E Unit 10
- 1342 S 140 E Unit 11
- 481 W 705 S Unit 2
- 797 S 500 E Unit 12
- 553 Strawberry Rd
- 1171 S 50 E
- 1146 S 50 E
- 1197 S 120 E
- 436 E 1220 S
- 567 S Hazel Dr
- 761 E Selman Ridge Dr Unit 72
- 334 E Selman Ridge Dr Unit 30
- 256 E Selman Ridge Dr Unit 21
- 285 E Selman Ridge Dr Unit 38
- 201 E Selman Ridge Dr Unit 40
- 179 E Selman Ridge Dr Unit 41
- 173 W 650 S Unit 10
- 896 S 320 E
- 895 S 270 E
- 914 S 320 E
- 914 S 320 E Unit 46
- 878 S 320 E
- 878 S 320 E Unit 48
- 879 S 270 E
- 879 S 270 E Unit 42
- 879 S 270 E Unit .23
- 915 S 270 E
- 915 S 270 E Unit 43
- 895 S 320 E
- 895 S 320 E Unit 50
- 895 S 320 E Unit 43
- 915 S 320 E
- 915 S 320 E Unit 51
- 879 S 320 E
- 879 S 320 E Unit 49
- 862 S 320 E
- 932 S 320 E
Your Personal Tour Guide
Ask me questions while you tour the home.