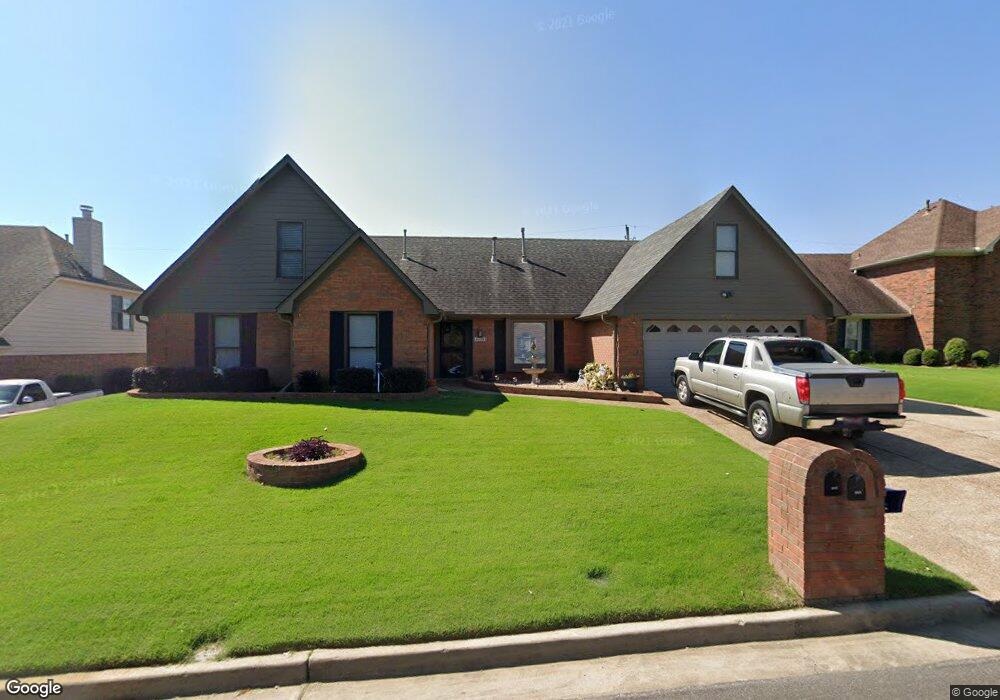
8963 Rowley Cove Cordova, TN 38016
Cordova NeighborhoodEstimated Value: $308,000 - $370,000
4
Beds
2
Baths
4,508
Sq Ft
$76/Sq Ft
Est. Value
About This Home
This home is located at 8963 Rowley Cove, Cordova, TN 38016 and is currently estimated at $342,558, approximately $75 per square foot. 8963 Rowley Cove is a home located in Shelby County with nearby schools including Riverwood Elementary School, Cordova High School, and Cordova Middle School.
Ownership History
Date
Name
Owned For
Owner Type
Purchase Details
Closed on
Feb 25, 2010
Sold by
Polk Steven M and Polk Branda F
Bought by
Dollar Glenn D and Dollar Creta L
Current Estimated Value
Purchase Details
Closed on
Apr 8, 2003
Sold by
Cendant Mobility Financial Corp
Bought by
Polk Steven M and Polk Branda F
Home Financials for this Owner
Home Financials are based on the most recent Mortgage that was taken out on this home.
Original Mortgage
$157,219
Interest Rate
5.79%
Mortgage Type
FHA
Purchase Details
Closed on
Nov 13, 2002
Sold by
Emenheiser Eric S and Emenheiser Laura A
Bought by
Cendant Mobility Financial Corp and Mid South Title Agency Inc
Purchase Details
Closed on
Jun 14, 2000
Sold by
Isbell Dean A and Isbell Kim E
Bought by
Emenheiser Eric S and Emenheiser Laura A
Home Financials for this Owner
Home Financials are based on the most recent Mortgage that was taken out on this home.
Original Mortgage
$100,500
Interest Rate
8%
Create a Home Valuation Report for This Property
The Home Valuation Report is an in-depth analysis detailing your home's value as well as a comparison with similar homes in the area
Home Values in the Area
Average Home Value in this Area
Purchase History
| Date | Buyer | Sale Price | Title Company |
|---|---|---|---|
| Dollar Glenn D | $143,226 | Realty Title | |
| Polk Steven M | $160,733 | Mid South Title Agency Inc | |
| Cendant Mobility Financial Corp | $181,250 | -- | |
| Emenheiser Eric S | $170,500 | Mid America Title Agency Inc | |
| Emenheiser Eric S | $170,500 | Mid America Title Agency Inc |
Source: Public Records
Mortgage History
| Date | Status | Borrower | Loan Amount |
|---|---|---|---|
| Previous Owner | Polk Steven M | $157,219 | |
| Previous Owner | Emenheiser Eric S | $100,500 |
Source: Public Records
Tax History Compared to Growth
Tax History
| Year | Tax Paid | Tax Assessment Tax Assessment Total Assessment is a certain percentage of the fair market value that is determined by local assessors to be the total taxable value of land and additions on the property. | Land | Improvement |
|---|---|---|---|---|
| 2025 | $2,176 | $93,475 | $17,500 | $75,975 |
| 2024 | $2,176 | $64,200 | $12,550 | $51,650 |
| 2023 | $3,911 | $64,200 | $12,550 | $51,650 |
| 2022 | $3,911 | $64,200 | $12,550 | $51,650 |
| 2021 | $3,957 | $64,200 | $12,550 | $51,650 |
| 2020 | $3,411 | $47,075 | $12,550 | $34,525 |
| 2019 | $3,184 | $47,075 | $12,550 | $34,525 |
| 2018 | $3,184 | $47,075 | $12,550 | $34,525 |
| 2017 | $1,935 | $47,075 | $12,550 | $34,525 |
| 2016 | $1,642 | $37,575 | $0 | $0 |
| 2014 | $1,642 | $37,575 | $0 | $0 |
Source: Public Records
Map
Nearby Homes
- 8920 Rowley Cove
- 1700 Belledeer Dr W
- 8897 Gooseberry Cove
- 9062 Raspberry Ln
- 8875 Linell Cove
- 9054 Chimneyrock Blvd
- 1916 Bohemia Dr
- 1965 Myron Cove N
- 1986 Wirily Ln
- 8915 Johnston St
- 8766 Wood Mills Cove W
- 0 Mt Pisgah Rd N
- 0 Red Vintage Cove
- 1770 Mill Glen Cove
- 8668 Stablemill Ln
- 8739 Cedar Mills Cir
- 1561 Cedar Farms Cove
- 1681 Magnolia Farms Cove
- 1636 Stablemill Cove
- 9238 Speerberry Ln
- 8957 Rowley Cove
- 8969 Rowley Cove
- 1755 Leafhopper Cove
- 8960 Rowley Cove
- 8975 Rowley Cove
- 8966 Rowley Cove
- 8949 Rowley Cove
- 1752 Leafhopper Cove
- 1751 Leafhopper Cove
- 8952 Rowley Cove
- 8974 Rowley Cove
- 8983 Rowley Cove
- 8944 Rowley Cove
- 8978 Raspberry Ln
- 8982 Rowley Cove
- 8953 Chimneyrock Blvd
- 8962 Raspberry Ln
- 1773 Elderberry Ln
- 8959 Chimneyrock Blvd
- 8945 Chimneyrock Blvd