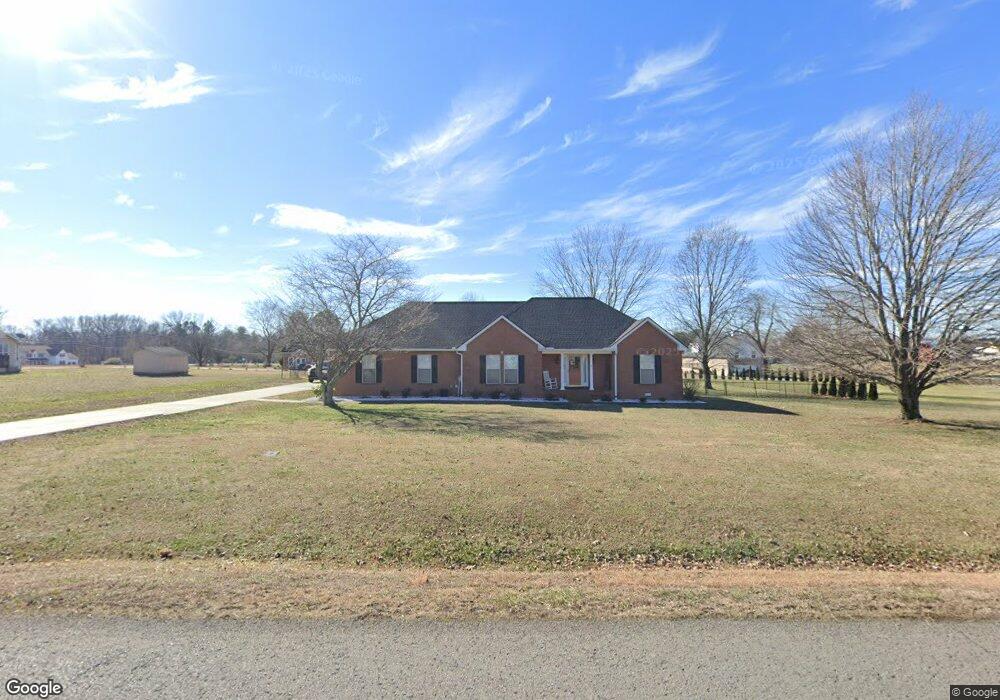
8967 Cedar Grove Rd Cross Plains, TN 37049
Estimated Value: $437,970 - $532,000
--
Bed
2
Baths
1,799
Sq Ft
$278/Sq Ft
Est. Value
About This Home
This home is located at 8967 Cedar Grove Rd, Cross Plains, TN 37049 and is currently estimated at $499,743, approximately $277 per square foot. 8967 Cedar Grove Rd is a home located in Robertson County with nearby schools including East Robertson Elementary School and East Robertson High School.
Ownership History
Date
Name
Owned For
Owner Type
Purchase Details
Closed on
Sep 9, 2013
Sold by
Tomlinson Bobby D
Bought by
Haggard Randy D and Haggard Jacqueline A
Current Estimated Value
Home Financials for this Owner
Home Financials are based on the most recent Mortgage that was taken out on this home.
Original Mortgage
$186,558
Outstanding Balance
$137,528
Interest Rate
4.25%
Mortgage Type
FHA
Estimated Equity
$362,215
Purchase Details
Closed on
Feb 26, 2010
Sold by
Mofield Michael J
Bought by
Tomlinson Bobby D
Purchase Details
Closed on
Nov 24, 2004
Sold by
Mofield Michael J
Bought by
Mofield Michael J
Home Financials for this Owner
Home Financials are based on the most recent Mortgage that was taken out on this home.
Original Mortgage
$160,000
Interest Rate
4.88%
Purchase Details
Closed on
Feb 18, 1999
Sold by
Leon Summers
Bought by
Mofield Michael J
Purchase Details
Closed on
Nov 7, 1997
Bought by
Summers Leon and Summers Nelia Ann
Create a Home Valuation Report for This Property
The Home Valuation Report is an in-depth analysis detailing your home's value as well as a comparison with similar homes in the area
Home Values in the Area
Average Home Value in this Area
Purchase History
| Date | Buyer | Sale Price | Title Company |
|---|---|---|---|
| Haggard Randy D | $190,000 | -- | |
| Tomlinson Bobby D | $165,000 | -- | |
| Mofield Michael J | -- | -- | |
| Mofield Michael J | $137,000 | -- | |
| Summers Leon | $25,400 | -- |
Source: Public Records
Mortgage History
| Date | Status | Borrower | Loan Amount |
|---|---|---|---|
| Open | Haggard Randy D | $186,558 | |
| Previous Owner | Summers Leon | $160,000 | |
| Previous Owner | Summers Leon | $30,000 |
Source: Public Records
Tax History Compared to Growth
Tax History
| Year | Tax Paid | Tax Assessment Tax Assessment Total Assessment is a certain percentage of the fair market value that is determined by local assessors to be the total taxable value of land and additions on the property. | Land | Improvement |
|---|---|---|---|---|
| 2025 | $1,872 | $104,000 | $0 | $0 |
| 2024 | $1,872 | $104,000 | $18,600 | $85,400 |
| 2023 | $1,732 | $104,000 | $18,600 | $85,400 |
| 2022 | $1,555 | $60,375 | $5,350 | $55,025 |
| 2021 | $1,555 | $60,375 | $5,350 | $55,025 |
| 2020 | $1,555 | $60,375 | $5,350 | $55,025 |
| 2019 | $1,555 | $60,375 | $5,350 | $55,025 |
| 2018 | $1,555 | $60,375 | $5,350 | $55,025 |
| 2017 | $1,370 | $44,400 | $5,650 | $38,750 |
| 2016 | $1,370 | $44,400 | $5,650 | $38,750 |
| 2015 | $1,314 | $44,400 | $5,650 | $38,750 |
| 2014 | $1,314 | $44,400 | $5,650 | $38,750 |
Source: Public Records
Map
Nearby Homes
- 4706 Rock House Rd
- 4628 Hwy 31w
- 1014 Somerville Dr
- 116 Bradley Ln
- 223 Raymond Hodges Rd
- 1002 Roland Ct
- 4675 Wills Rd
- 320 Spring Valley Dr
- 541 Clearview Rd
- 358 Spring Valley Dr
- 4984 Somerville Rd
- 572 Buntin Mill Rd
- 8338 Guthrie Rd
- 1031 Kennedy Ln
- 8935 Cedar Grove Rd
- 293 Aplin Branch Rd
- 1040 Washington Dr
- 8288 Guthrie Rd
- 6400 Williams Rd
- 0 Highway 25 Unit RTC3033551
- 8972 Cedar Grove Rd
- 4581 S Old Highway 31 W
- 8973 Cedar Grove Rd
- 4573 S Old 31w
- 8966 Cedar Grove Rd
- 4729 Highway 31 W
- 4739 Highway 31 W
- 4773 Highway 31 W
- 4773 U S 31w
- 4545 S Old Highway 31 W
- 4719 Highway 31 W
- 0 S Old Highway 31w Unit RTC2385953
- 0 S Old Highway 31w Unit RTC2385952
- 4781 Highway 31 W
- 4550 S Old Highway 31 W
- 4760 Highway 31 W
- 4760 31w Hwy
- 4770 Highway 31 W
- 4750 Highway 31 W
- 4750 Highway 31 W