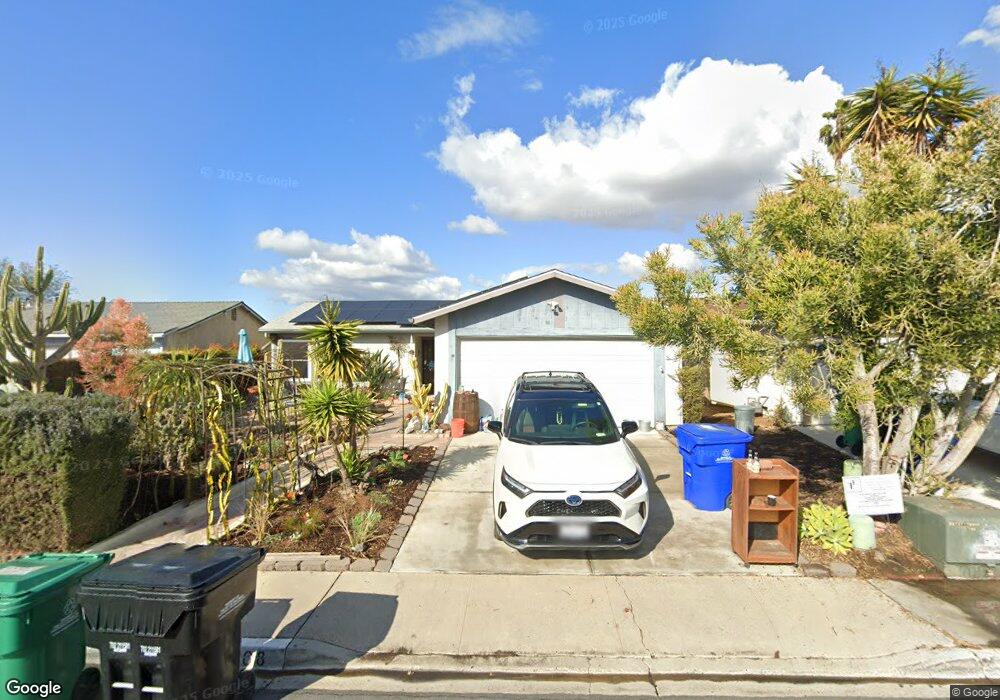
8968 Via Caracas San Diego, CA 92126
Mira Mesa NeighborhoodEstimated Value: $924,749 - $985,000
2
Beds
2
Baths
1,008
Sq Ft
$940/Sq Ft
Est. Value
About This Home
This home is located at 8968 Via Caracas, San Diego, CA 92126 and is currently estimated at $947,687, approximately $940 per square foot. 8968 Via Caracas is a home located in San Diego County with nearby schools including Hage Elementary School, Wangenheim Middle School, and Mira Mesa High School.
Ownership History
Date
Name
Owned For
Owner Type
Purchase Details
Closed on
Aug 11, 2000
Sold by
Cope John D
Bought by
Puaoi Deidre L
Current Estimated Value
Home Financials for this Owner
Home Financials are based on the most recent Mortgage that was taken out on this home.
Original Mortgage
$204,750
Interest Rate
7.98%
Purchase Details
Closed on
Sep 17, 1993
Sold by
Katz Martin H and Katz Lorraine F
Bought by
Cope John D and Cope Rebecca
Home Financials for this Owner
Home Financials are based on the most recent Mortgage that was taken out on this home.
Original Mortgage
$144,200
Interest Rate
6.74%
Mortgage Type
VA
Purchase Details
Closed on
Mar 25, 1986
Create a Home Valuation Report for This Property
The Home Valuation Report is an in-depth analysis detailing your home's value as well as a comparison with similar homes in the area
Home Values in the Area
Average Home Value in this Area
Purchase History
| Date | Buyer | Sale Price | Title Company |
|---|---|---|---|
| Puaoi Deidre L | $227,500 | Fidelity National Title | |
| Cope John D | $140,000 | Continental Lawyers Title | |
| -- | $98,000 | -- |
Source: Public Records
Mortgage History
| Date | Status | Borrower | Loan Amount |
|---|---|---|---|
| Previous Owner | Puaoi Deidre L | $204,750 | |
| Previous Owner | Cope John D | $144,200 |
Source: Public Records
Tax History Compared to Growth
Tax History
| Year | Tax Paid | Tax Assessment Tax Assessment Total Assessment is a certain percentage of the fair market value that is determined by local assessors to be the total taxable value of land and additions on the property. | Land | Improvement |
|---|---|---|---|---|
| 2025 | $4,094 | $342,781 | $121,336 | $221,445 |
| 2024 | $4,094 | $336,060 | $118,957 | $217,103 |
| 2023 | $4,001 | $329,472 | $116,625 | $212,847 |
| 2022 | $3,892 | $323,013 | $114,339 | $208,674 |
| 2021 | $3,864 | $316,681 | $112,098 | $204,583 |
| 2020 | $3,816 | $313,435 | $110,949 | $202,486 |
| 2019 | $3,746 | $307,290 | $108,774 | $198,516 |
| 2018 | $3,503 | $301,266 | $106,642 | $194,624 |
| 2017 | $81 | $295,359 | $104,551 | $190,808 |
| 2016 | $3,358 | $289,568 | $102,501 | $187,067 |
| 2015 | $3,307 | $285,220 | $100,962 | $184,258 |
| 2014 | $3,255 | $279,634 | $98,985 | $180,649 |
Source: Public Records
Map
Nearby Homes
- 8943 Calliandra Rd
- 8727 Westmore Rd Unit 24
- 10805 Eberly Ct
- 8669 Summerdale Rd
- 8670 New Salem St Unit 106
- 8650 New Salem St Unit 27
- 8644 New Salem St Unit 6
- 8654 New Salem St Unit 44
- 10770 Black Mountain Rd Unit 220
- 10770 Black Mountain Rd
- 10582 Caminito Glenellen
- 8595 Summerdale Rd Unit 170
- 10771 Black Mountain Rd Unit 58
- 8485 Westmore Rd Unit 40
- 8488 New Salem St
- 8476 New Salem St Unit 77
- 8479 Westmore Rd Unit 55
- 10422 Londonderry Ave
- 8849 Capricorn Way
- 9310 Galvin Ave Unit 15
- 8974 Via Caracas
- 8962 Via Caracas
- 8956 Via Caracas
- 8955 Westmore Rd
- 8980 Via Caracas
- 8965 Westmore Rd
- 8945 Westmore Rd
- 8975 Westmore Rd
- 8950 Via Caracas
- 8935 Westmore Rd
- 8971 Via Caracas
- 8985 Westmore Rd
- 8963 Via Caracas
- 8986 Via Caracas
- 8987 Via Caracas
- 8955 Via Caracas
- 10897 Via San Blas
- 8944 Via Caracas
- 8995 Westmore Rd
- 8949 Via Caracas