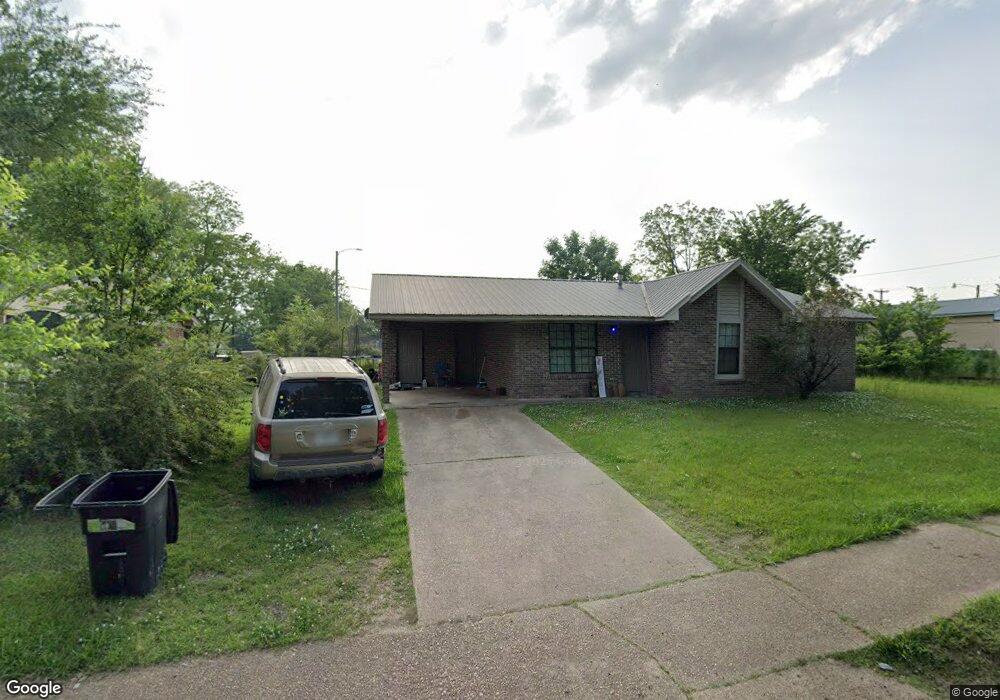
897 N Division St West Point, MS 39773
Estimated Value: $101,000 - $139,000
3
Beds
--
Bath
1,264
Sq Ft
$92/Sq Ft
Est. Value
About This Home
This home is located at 897 N Division St, West Point, MS 39773 and is currently estimated at $115,911, approximately $91 per square foot. 897 N Division St is a home with nearby schools including East Side Elementary School, West Clay Elementary School, and Church Hill Elementary School.
Ownership History
Date
Name
Owned For
Owner Type
Purchase Details
Closed on
Nov 5, 2012
Sold by
Stallings Belton
Bought by
Stallings Ivery R
Current Estimated Value
Purchase Details
Closed on
Oct 1, 2010
Sold by
Hodo Pete and Facella Marc
Bought by
Jackson Corine
Home Financials for this Owner
Home Financials are based on the most recent Mortgage that was taken out on this home.
Original Mortgage
$59,001
Interest Rate
4.36%
Create a Home Valuation Report for This Property
The Home Valuation Report is an in-depth analysis detailing your home's value as well as a comparison with similar homes in the area
Home Values in the Area
Average Home Value in this Area
Purchase History
| Date | Buyer | Sale Price | Title Company |
|---|---|---|---|
| Stallings Ivery R | -- | -- | |
| Jackson Corine | -- | -- |
Source: Public Records
Mortgage History
| Date | Status | Borrower | Loan Amount |
|---|---|---|---|
| Previous Owner | Jackson Corine | $59,001 |
Source: Public Records
Tax History Compared to Growth
Tax History
| Year | Tax Paid | Tax Assessment Tax Assessment Total Assessment is a certain percentage of the fair market value that is determined by local assessors to be the total taxable value of land and additions on the property. | Land | Improvement |
|---|---|---|---|---|
| 2024 | $555 | $10,240 | $1,107 | $9,133 |
| 2023 | $1,277 | $8,534 | $1,107 | $7,427 |
| 2022 | $465 | $8,534 | $1,107 | $7,427 |
| 2021 | $448 | $8,285 | $1,107 | $7,178 |
| 2020 | $450 | $8,285 | $1,107 | $7,178 |
| 2019 | $422 | $8,220 | $1,107 | $7,113 |
| 2018 | $0 | $5,480 | $738 | $4,742 |
| 2017 | $0 | $5,480 | $738 | $4,742 |
| 2016 | -- | $5,480 | $738 | $4,742 |
| 2015 | -- | $5,304 | $738 | $4,566 |
| 2014 | $360 | $5,304 | $738 | $4,566 |
| 2013 | $360 | $5,304 | $738 | $4,566 |
Source: Public Records
Map
Nearby Homes
- 63 Clay St
- 0 Mississippi 50
- 26788 E Main St
- 218 Lewellen St
- 530 E Morrow St
- 26852 E Main St
- 564 E Morrow St
- 184 Tournament St
- 98 Court St
- 228 S Division St
- 229 S Division St
- 159 Washington St
- 206 S Division St
- 26596 E Main St
- 27045 E Main St
- 318 Progress St
- 1104 E Broad St
- 479 E Westbrook St
- 485 E Westbrook St
- 480 E Westbrook St
- 407 S Division St
- 890 N Division St
- 876 N Division St
- 103 Morgan St
- 107 Morgan St
- 412 N Division St
- 111 Morgan St
- 220 Morgan St
- 115 Morgan St
- 846 N Division St
- 407 N Division St
- 424 Critz St
- 418 Critz St
- 333 N Division St
- 410 Critz St
- 233 Morgan St
- 223 Morgan St
- 406 Critz St
- 114 Morgan St
- 830 N Division St