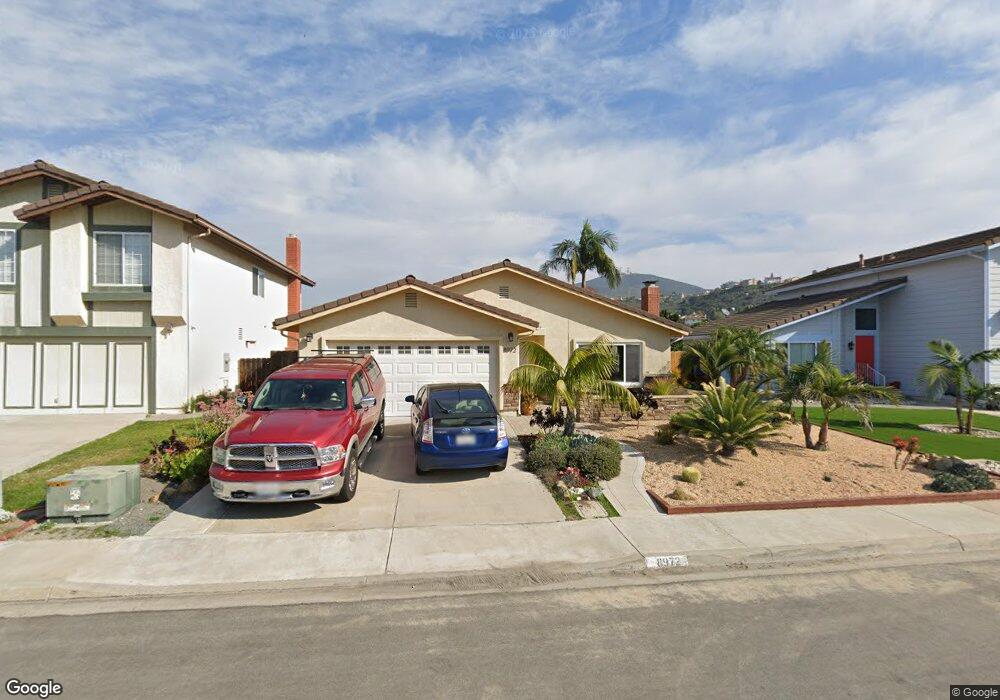
8972 Allenbrook Way San Diego, CA 92129
Rancho Peñasquitos NeighborhoodEstimated Value: $1,253,323 - $1,397,000
3
Beds
2
Baths
1,640
Sq Ft
$804/Sq Ft
Est. Value
About This Home
This home is located at 8972 Allenbrook Way, San Diego, CA 92129 and is currently estimated at $1,318,081, approximately $803 per square foot. 8972 Allenbrook Way is a home located in San Diego County with nearby schools including Adobe Bluffs Elementary School, Black Mountain Middle School, and Mt. Carmel High School.
Ownership History
Date
Name
Owned For
Owner Type
Purchase Details
Closed on
Aug 25, 2016
Sold by
Harrigan Joseph J and Paulas Cynthia A
Bought by
Harrigan Joseph J and Paulas Cynthia A
Current Estimated Value
Purchase Details
Closed on
Jun 12, 1996
Sold by
Keith Godwin R and Keith Silvia N
Bought by
Harrigan Joseph J and Paulas Cynthia A
Home Financials for this Owner
Home Financials are based on the most recent Mortgage that was taken out on this home.
Original Mortgage
$203,000
Outstanding Balance
$12,982
Interest Rate
8.01%
Mortgage Type
VA
Estimated Equity
$1,305,099
Purchase Details
Closed on
Oct 4, 1993
Sold by
Godwin R Keith and Mirochnik Silvia N
Bought by
Godwin R Keith and Godwin Silvia N
Home Financials for this Owner
Home Financials are based on the most recent Mortgage that was taken out on this home.
Original Mortgage
$144,000
Interest Rate
6.98%
Purchase Details
Closed on
Apr 30, 1987
Purchase Details
Closed on
Feb 27, 1984
Create a Home Valuation Report for This Property
The Home Valuation Report is an in-depth analysis detailing your home's value as well as a comparison with similar homes in the area
Home Values in the Area
Average Home Value in this Area
Purchase History
| Date | Buyer | Sale Price | Title Company |
|---|---|---|---|
| Harrigan Joseph J | -- | None Available | |
| Harrigan Joseph J | $200,000 | Old Republic Title Company | |
| Godwin R Keith | -- | Gateway Title Company | |
| -- | $154,000 | -- | |
| -- | $119,000 | -- |
Source: Public Records
Mortgage History
| Date | Status | Borrower | Loan Amount |
|---|---|---|---|
| Open | Harrigan Joseph J | $203,000 | |
| Previous Owner | Godwin R Keith | $144,000 |
Source: Public Records
Tax History Compared to Growth
Tax History
| Year | Tax Paid | Tax Assessment Tax Assessment Total Assessment is a certain percentage of the fair market value that is determined by local assessors to be the total taxable value of land and additions on the property. | Land | Improvement |
|---|---|---|---|---|
| 2025 | $3,647 | $332,220 | $116,486 | $215,734 |
| 2024 | $3,647 | $325,706 | $114,202 | $211,504 |
| 2023 | $3,567 | $319,320 | $111,963 | $207,357 |
| 2022 | $3,505 | $313,060 | $109,768 | $203,292 |
| 2021 | $3,457 | $306,922 | $107,616 | $199,306 |
| 2020 | $3,409 | $303,776 | $106,513 | $197,263 |
| 2019 | $3,320 | $297,821 | $104,425 | $193,396 |
| 2018 | $3,225 | $291,982 | $102,378 | $189,604 |
| 2017 | $3,137 | $286,258 | $100,371 | $185,887 |
| 2016 | $3,071 | $280,646 | $98,403 | $182,243 |
| 2015 | $3,024 | $276,431 | $96,925 | $179,506 |
| 2014 | $2,952 | $271,017 | $95,027 | $175,990 |
Source: Public Records
Map
Nearby Homes
- 8730 Twin Trails Dr
- 13907 Bruyere Ct
- 13559 Chaco Ct
- 8862 La Cartera St
- 9360 Stargaze Ave
- 9120 Meadowrun Place
- 14305 El Vestido St
- 14442 Calle Nublado
- 13445 Appalachian Way
- 13146 Thunderhead St
- 13411 Appalachian Way
- 13640 Via Cima Bella
- 9151 Emden Rd
- 9555 Via Pereza
- 9302 Twin Trails Dr Unit 204
- 12880 War Horse St
- 9488 Hiker Hill Rd
- 12740 Prairie Dog Ave
- 9342 Twin Trails Dr Unit 303
- 9858 Via Caceres
- 8966 Allenbrook Way
- 8978 Allenbrook Way
- 8958 Allenbrook Way
- 8984 Allenbrook Way
- 13928 Barrymore St
- 13924 Barrymore St
- 8969 Allenbrook Way
- 13932 Barrymore St
- 8979 Allenbrook Way
- 13918 Barrymore St
- 8959 Allenbrook Way
- 8950 Allenbrook Way
- 8988 Allenbrook Way
- 8989 Allenbrook Way
- 13936 Barrymore St
- 8949 Allenbrook Way
- 13914 Barrymore St
- 8942 Allenbrook Way
- 8996 Allenbrook Way
- 13940 Barrymore St