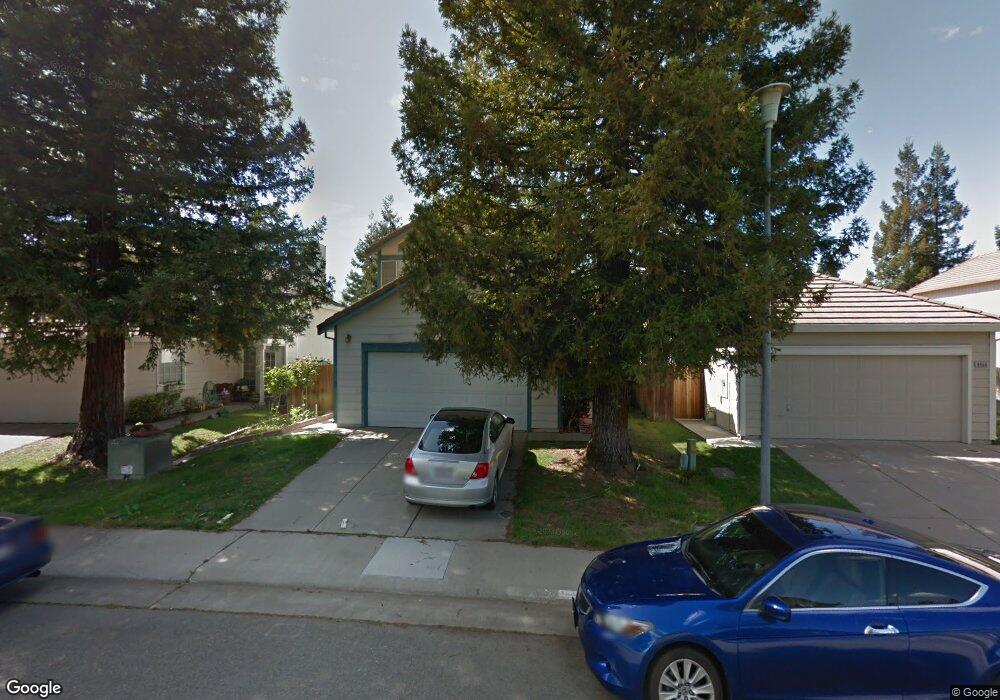
8972 Beryl Creek Way Elk Grove, CA 95758
North West Elk Grove NeighborhoodEstimated Value: $526,000 - $571,000
3
Beds
3
Baths
1,762
Sq Ft
$311/Sq Ft
Est. Value
About This Home
This home is located at 8972 Beryl Creek Way, Elk Grove, CA 95758 and is currently estimated at $548,740, approximately $311 per square foot. 8972 Beryl Creek Way is a home located in Sacramento County with nearby schools including Marion Mix Elementary School, Harriet G. Eddy Middle School, and Laguna Creek High School.
Ownership History
Date
Name
Owned For
Owner Type
Purchase Details
Closed on
May 5, 2004
Sold by
Lantsberger Philip and Lantsberger Catherine
Bought by
Tomanpos Warren P and Tomanpos Maria M
Current Estimated Value
Home Financials for this Owner
Home Financials are based on the most recent Mortgage that was taken out on this home.
Original Mortgage
$256,000
Outstanding Balance
$109,401
Interest Rate
4.25%
Mortgage Type
Negative Amortization
Estimated Equity
$439,339
Purchase Details
Closed on
Oct 23, 1997
Sold by
Lantsberger Philip
Bought by
Lantsberger Philip and Lantsberger Catherine S
Home Financials for this Owner
Home Financials are based on the most recent Mortgage that was taken out on this home.
Original Mortgage
$55,000
Interest Rate
7.49%
Create a Home Valuation Report for This Property
The Home Valuation Report is an in-depth analysis detailing your home's value as well as a comparison with similar homes in the area
Home Values in the Area
Average Home Value in this Area
Purchase History
| Date | Buyer | Sale Price | Title Company |
|---|---|---|---|
| Tomanpos Warren P | $320,000 | Chicago Title Co | |
| Lantsberger Philip | -- | Fidelity National Title Ins |
Source: Public Records
Mortgage History
| Date | Status | Borrower | Loan Amount |
|---|---|---|---|
| Open | Tomanpos Warren P | $256,000 | |
| Previous Owner | Lantsberger Philip | $226,100 | |
| Previous Owner | Lantsberger Philip | $96,400 | |
| Previous Owner | Lantsberger Philip | $55,000 |
Source: Public Records
Tax History Compared to Growth
Tax History
| Year | Tax Paid | Tax Assessment Tax Assessment Total Assessment is a certain percentage of the fair market value that is determined by local assessors to be the total taxable value of land and additions on the property. | Land | Improvement |
|---|---|---|---|---|
| 2025 | $5,221 | $454,958 | $95,961 | $358,997 |
| 2024 | $5,221 | $446,038 | $94,080 | $351,958 |
| 2023 | $5,078 | $437,293 | $92,236 | $345,057 |
| 2022 | $4,993 | $428,720 | $90,428 | $338,292 |
| 2021 | $4,908 | $420,314 | $88,655 | $331,659 |
| 2020 | $4,361 | $370,922 | $84,781 | $286,141 |
| 2019 | $4,098 | $346,657 | $79,235 | $267,422 |
| 2018 | $3,919 | $333,325 | $76,188 | $257,137 |
| 2017 | $3,683 | $311,519 | $71,204 | $240,315 |
| 2016 | $3,339 | $288,444 | $65,930 | $222,514 |
| 2015 | $3,052 | $262,223 | $59,937 | $202,286 |
| 2014 | $2,913 | $247,380 | $56,544 | $190,836 |
Source: Public Records
Map
Nearby Homes
- 5013 Efthemia Way
- 8959 Boreal Way
- 0 Elliott Ranch Rd Unit 225131105
- 5161 Saint Edwards Way
- Residence 2125 Plan at Tegan Estates
- Residence 1845 Plan at Tegan Estates
- Residence 1960 Plan at Tegan Estates
- Residence 1850 Plan at Tegan Estates
- 9105 Turnbull Ct
- 9121 Hensley Way
- 9139 Hensley Way
- 9144 Hensley Way
- 5310 Privet Ln
- 9186 Jamel Ct
- 8741 Noble Fir Ln
- 8944 Warmsprings St
- 5201 Laguna Oaks Dr Unit 96
- 5201 Laguna Oaks Dr Unit 70
- 5201 Laguna Oaks Dr Unit 5
- 6024 Deepdale Way
- 8968 Beryl Creek Way
- 8976 Beryl Creek Way
- 8964 Beryl Creek Way
- 8980 Beryl Creek Way
- 5212 Harbourglen Way
- 5208 Harbourglen Way
- 5216 Harbourglen Way
- 8960 Beryl Creek Way
- 8984 Beryl Creek Way
- 8973 Beryl Creek Way
- 5204 Harbourglen Way
- 5220 Harbourglen Way
- 8980 Amber Creek Dr
- 8969 Beryl Creek Way
- 8981 Beryl Creek Way
- 8988 Beryl Creek Way
- 5200 Harbourglen Way
- 5213 Marble Creek Ct
- 8987 Beryl Creek Way
- 5217 Marble Creek Ct