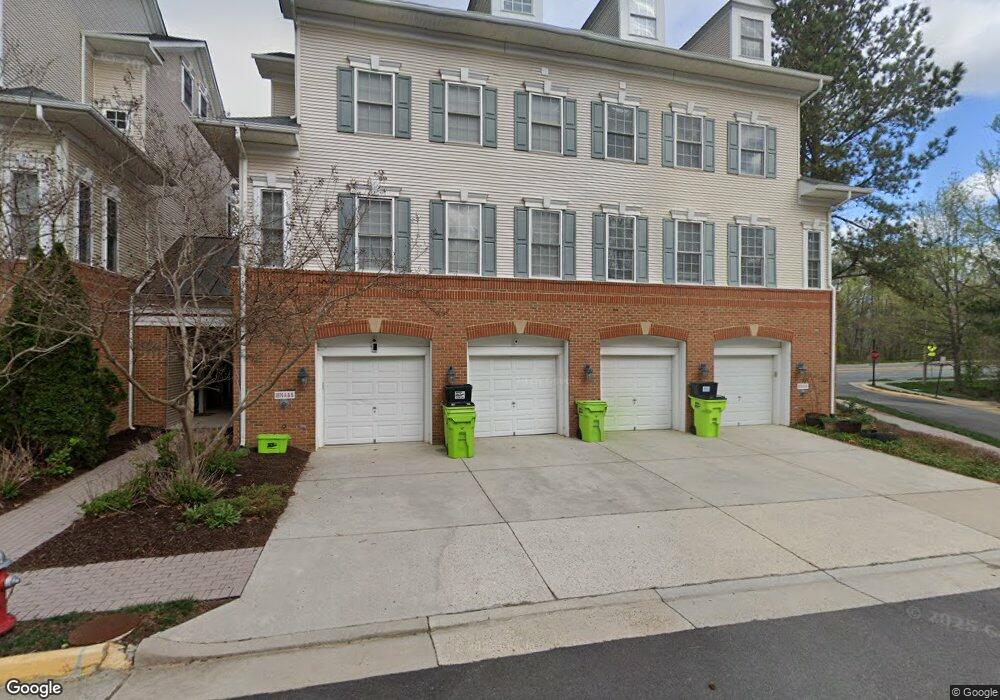
8976 Harrover Place Unit 76A Lorton, VA 22079
Pohick NeighborhoodEstimated Value: $470,698 - $491,000
3
Beds
3
Baths
1,695
Sq Ft
$283/Sq Ft
Est. Value
About This Home
This home is located at 8976 Harrover Place Unit 76A, Lorton, VA 22079 and is currently estimated at $480,175, approximately $283 per square foot. 8976 Harrover Place Unit 76A is a home located in Fairfax County with nearby schools including Hayfield Secondary School, The Springs at Montessori School, and Angelus Academy.
Ownership History
Date
Name
Owned For
Owner Type
Purchase Details
Closed on
Apr 7, 2022
Sold by
Norris Aaron L
Bought by
Marsh Simon R and Shibata Joy
Current Estimated Value
Home Financials for this Owner
Home Financials are based on the most recent Mortgage that was taken out on this home.
Original Mortgage
$399,789
Interest Rate
3.89%
Mortgage Type
VA
Purchase Details
Closed on
Apr 24, 2015
Sold by
Mccullough Nancy
Bought by
Norris Aaron L
Home Financials for this Owner
Home Financials are based on the most recent Mortgage that was taken out on this home.
Original Mortgage
$306,450
Interest Rate
3.86%
Mortgage Type
VA
Purchase Details
Closed on
Oct 3, 2005
Sold by
Lorton Station Llc
Bought by
Mccullough Kevin
Home Financials for this Owner
Home Financials are based on the most recent Mortgage that was taken out on this home.
Original Mortgage
$330,900
Interest Rate
5.81%
Mortgage Type
New Conventional
Create a Home Valuation Report for This Property
The Home Valuation Report is an in-depth analysis detailing your home's value as well as a comparison with similar homes in the area
Home Values in the Area
Average Home Value in this Area
Purchase History
| Date | Buyer | Sale Price | Title Company |
|---|---|---|---|
| Marsh Simon R | $414,000 | Kvs Title | |
| Marsh Simon R | $365,200 | New Title Company Name | |
| Marsh Simon R | $365,200 | New Title Company Name | |
| Norris Aaron L | $300,000 | -- | |
| Mccullough Kevin | $413,667 | -- |
Source: Public Records
Mortgage History
| Date | Status | Borrower | Loan Amount |
|---|---|---|---|
| Closed | Marsh Simon R | $399,789 | |
| Closed | Marsh Simon R | $399,789 | |
| Previous Owner | Norris Aaron L | $306,450 | |
| Previous Owner | Mccullough Kevin | $330,900 |
Source: Public Records
Tax History Compared to Growth
Tax History
| Year | Tax Paid | Tax Assessment Tax Assessment Total Assessment is a certain percentage of the fair market value that is determined by local assessors to be the total taxable value of land and additions on the property. | Land | Improvement |
|---|---|---|---|---|
| 2025 | $4,661 | $418,400 | $84,000 | $334,400 |
| 2024 | $4,661 | $402,310 | $80,000 | $322,310 |
| 2023 | $4,451 | $394,420 | $79,000 | $315,420 |
| 2022 | $4,176 | $365,200 | $73,000 | $292,200 |
| 2021 | $3,896 | $332,000 | $66,000 | $266,000 |
| 2020 | $3,742 | $316,190 | $63,000 | $253,190 |
| 2019 | $3,465 | $292,770 | $56,000 | $236,770 |
| 2018 | $3,207 | $278,830 | $56,000 | $222,830 |
| 2017 | $3,337 | $287,450 | $57,000 | $230,450 |
| 2016 | $3,330 | $287,450 | $57,000 | $230,450 |
| 2015 | $3,208 | $287,450 | $57,000 | $230,450 |
| 2014 | -- | $273,760 | $55,000 | $218,760 |
Source: Public Records
Map
Nearby Homes
- 8909 Robert Lundy Place
- 8934 Milford Haven Ct Unit 34A
- 8934 Milford Haven Ct Unit B
- 9000 Lorton Station Blvd Unit 205
- 9000 Lorton Station Blvd Unit 2-115
- 9000 Lorton Station Blvd Unit 209
- 7663 Henry Knox Dr
- 8902 Waites Way
- 8927 Waites Way
- 8902 Sylvania St
- 7757 Grandwind Dr
- 7744 Grandwind Dr
- 8715 Wadebrook Terrace
- 8915 Sylvania St
- 9140 Stonegarden Dr
- 9150 Stonegarden Dr
- 9237 Old Beech Ct
- 8815 Jandell Rd
- 7730 Shadowcreek Terrace
- 8817 Lagrange St
- 8976 Harrover Place Unit 76A
- 8976 Harrover Place Unit 76B
- 8974 Harrover Place Unit 74B
- 8974 Harrover Place Unit 74A
- 8978 Harrover Place Unit 78A
- 8980 Harrover Place Unit 80A
- 8984 Harrover Place B
- 8975 Harrover Place Unit 75B
- 8977 Harrover Place Unit 77B
- 8975 Harrover Place
- 8979 Harrover Place Unit 79A
- 8979 Harrover Place Unit 79B
- 8975 Harrover Place B Unit 75B
- 8982 Harrover Place Unit A
- 8984 Harrover Place Unit 84A
- 8982 Harrover Place Unit 82A
- 8982 Harrover Place Unit 82B
- 8984 Harrover Place
- 8984 Harrover Place Unit 84B
- 8986 Harrover Place Unit 86B