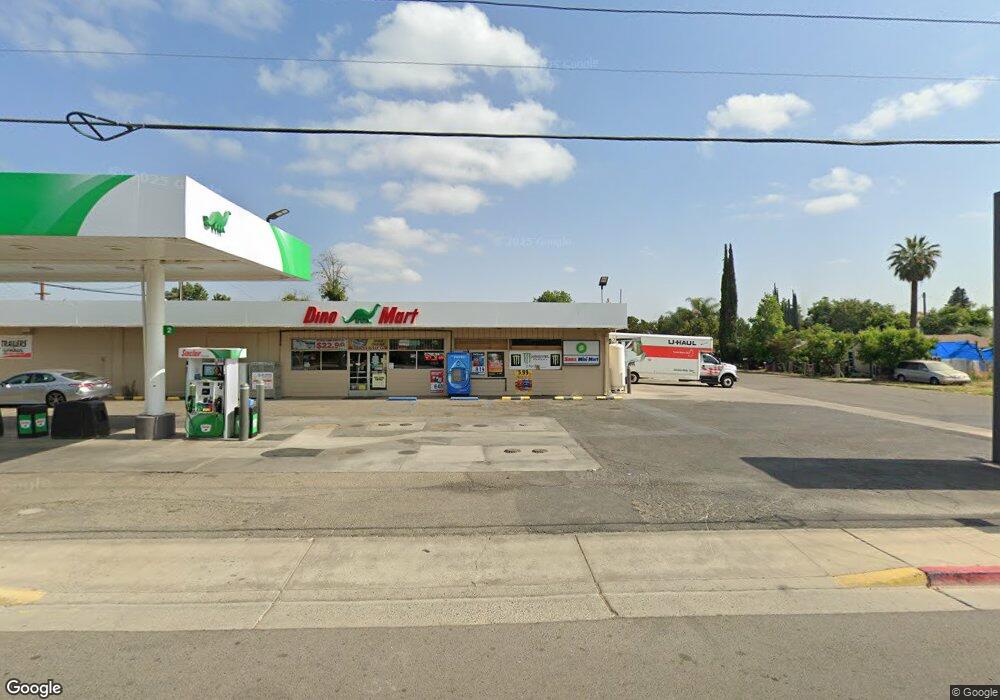
898 E Visalia Rd Farmersville, CA 93223
Estimated Value: $831,549
--
Bed
2
Baths
4,000
Sq Ft
$208/Sq Ft
Est. Value
About This Home
This home is located at 898 E Visalia Rd, Farmersville, CA 93223 and is currently estimated at $831,549, approximately $207 per square foot. 898 E Visalia Rd is a home located in Tulare County with nearby schools including J.E. Hester Elementary School, George L. Snowden Elementary School, and Freedom Elementary School.
Ownership History
Date
Name
Owned For
Owner Type
Purchase Details
Closed on
Dec 10, 2019
Sold by
Rajabali Shirin and Rajabali Shirin N
Bought by
Rajabali Shirin Nizam and Rajabali Shirin Nizam
Current Estimated Value
Purchase Details
Closed on
Mar 27, 2007
Sold by
Rajabali Nizam T and Rajabali Shirin
Bought by
The City Of Farmersville
Purchase Details
Closed on
Dec 19, 2001
Sold by
Deeb Salah Anthony and Deeb Elham
Bought by
Rajabali Nizam T and Rajabali Shirin
Home Financials for this Owner
Home Financials are based on the most recent Mortgage that was taken out on this home.
Original Mortgage
$200,000
Interest Rate
7.18%
Mortgage Type
Commercial
Purchase Details
Closed on
Aug 18, 1999
Sold by
Min Duk Mee
Bought by
Deeb Salah Anthony and Deeb Elham
Home Financials for this Owner
Home Financials are based on the most recent Mortgage that was taken out on this home.
Original Mortgage
$288,000
Interest Rate
7.68%
Mortgage Type
Commercial
Create a Home Valuation Report for This Property
The Home Valuation Report is an in-depth analysis detailing your home's value as well as a comparison with similar homes in the area
Home Values in the Area
Average Home Value in this Area
Purchase History
| Date | Buyer | Sale Price | Title Company |
|---|---|---|---|
| Rajabali Shirin Nizam | -- | None Available | |
| The City Of Farmersville | -- | None Available | |
| Rajabali Nizam T | $245,000 | Cuesta Title | |
| Deeb Salah Anthony | $300,000 | Fidelity National Title |
Source: Public Records
Mortgage History
| Date | Status | Borrower | Loan Amount |
|---|---|---|---|
| Previous Owner | Rajabali Nizam T | $200,000 | |
| Previous Owner | Deeb Salah Anthony | $288,000 |
Source: Public Records
Tax History Compared to Growth
Tax History
| Year | Tax Paid | Tax Assessment Tax Assessment Total Assessment is a certain percentage of the fair market value that is determined by local assessors to be the total taxable value of land and additions on the property. | Land | Improvement |
|---|---|---|---|---|
| 2025 | $5,953 | $361,948 | $103,413 | $258,535 |
| 2024 | $5,953 | $534,196 | $101,386 | $432,810 |
| 2023 | $5,995 | $525,854 | $99,399 | $426,455 |
| 2022 | $5,232 | $485,740 | $97,450 | $388,290 |
| 2021 | $5,020 | $465,902 | $95,539 | $370,363 |
| 2020 | $4,890 | $450,518 | $94,559 | $355,959 |
| 2019 | $5,578 | $501,021 | $92,705 | $408,316 |
| 2018 | $4,777 | $430,549 | $90,887 | $339,662 |
| 2017 | $4,688 | $414,090 | $89,105 | $324,985 |
| 2016 | $4,414 | $398,683 | $87,358 | $311,325 |
| 2015 | $4,299 | $386,522 | $86,046 | $300,476 |
| 2014 | $4,299 | $392,062 | $84,360 | $307,702 |
Source: Public Records
Map
Nearby Homes
- 738 E Larry St
- 680 E Larry St
- 885 E Ash St
- 903 E Ash St
- 732 N Dwight Ave
- 438 N Magnolia Ave
- 528 S Camelia Ave
- 753 N Brundage Ave
- 209 S Magnolia Ave
- 327 S Farmersville Blvd
- 701 Farmersville Rd
- 245 W Oakland St
- 896 Farmersville Rd
- 0 S Farmersville Blvd Unit 238390
- 322 E Citrus Dr
- 0 Avenue 288
- 896 N Mariposa Ave
- 1643 Tehama Ave
- 0 Avenue 288
- 605 S Anderson B Rd
- 854 E Visalia Rd
- 217 E Visalia Rd
- 186 N Gene Ave
- 152 N Dwight Ave
- 182 N Dwight Ave
- 168 N Dwight Ave
- 203 N Dwight Ave
- 208 N Gene Ave
- 229 N Dwight Ave
- 980 E Visalia Rd
- 203 N Gene Ave
- 234 N Gene Ave
- 198 N Dwight Ave
- 758 E Visalia Rd
- 210 N Dwight Ave
- 769 E Larry St
- 245 N Dwight Ave
- 998 E Visalia Rd
- 256 N Gene Ave
- 224 N Dwight Ave