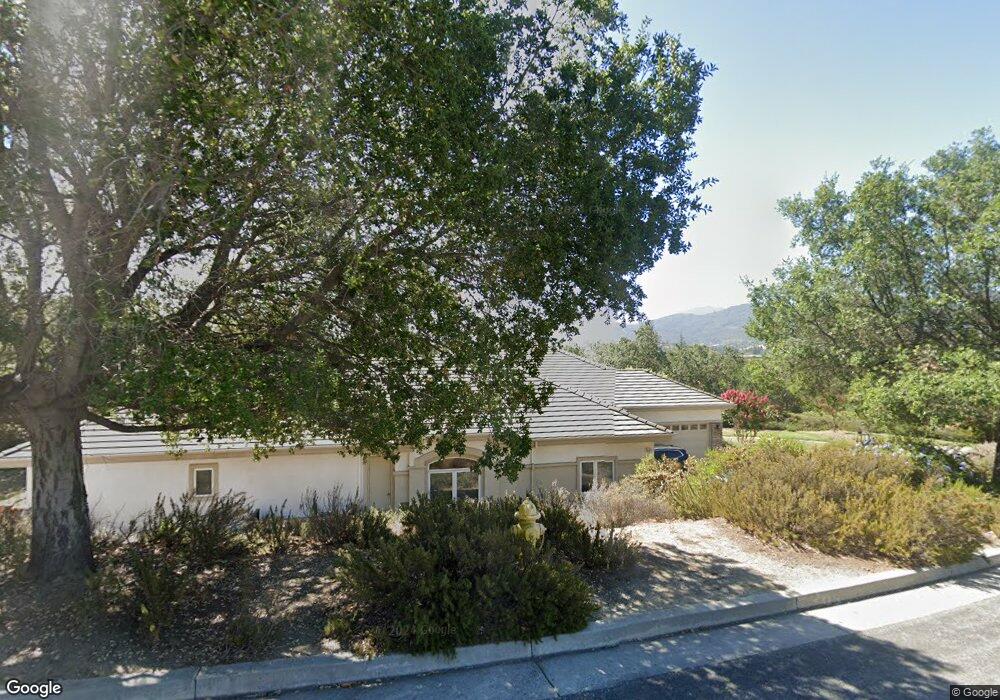
898 Vista Del Roble Place San Jose, CA 95120
Pfieffer NeighborhoodEstimated Value: $3,589,000 - $4,145,000
4
Beds
4
Baths
4,426
Sq Ft
$862/Sq Ft
Est. Value
About This Home
This home is located at 898 Vista Del Roble Place, San Jose, CA 95120 and is currently estimated at $3,814,852, approximately $861 per square foot. 898 Vista Del Roble Place is a home located in Santa Clara County with nearby schools including Graystone Elementary School, Bret Harte Middle School, and Leland High School.
Ownership History
Date
Name
Owned For
Owner Type
Purchase Details
Closed on
Sep 30, 2005
Sold by
Taccini Robert J
Bought by
Taccini Robert J
Current Estimated Value
Purchase Details
Closed on
May 3, 2002
Sold by
Taccini Robert J and Taccini Helen R
Bought by
Taccini Robert J and Taccini Helen R
Purchase Details
Closed on
Sep 2, 1999
Sold by
Pfeiffer Ranch Invrs Inc
Bought by
Taccini Robert J and Taccini Helen R
Home Financials for this Owner
Home Financials are based on the most recent Mortgage that was taken out on this home.
Original Mortgage
$1,000,000
Outstanding Balance
$294,872
Interest Rate
7.75%
Mortgage Type
Purchase Money Mortgage
Estimated Equity
$3,519,980
Purchase Details
Closed on
Mar 20, 1996
Sold by
Pfeiffer Norbert P and Pfeiffer Walter J
Bought by
Pfeiffer Ranch Investors Inc
Home Financials for this Owner
Home Financials are based on the most recent Mortgage that was taken out on this home.
Original Mortgage
$2,800,000
Interest Rate
8.13%
Mortgage Type
Construction
Create a Home Valuation Report for This Property
The Home Valuation Report is an in-depth analysis detailing your home's value as well as a comparison with similar homes in the area
Home Values in the Area
Average Home Value in this Area
Purchase History
| Date | Buyer | Sale Price | Title Company |
|---|---|---|---|
| Taccini Robert J | -- | -- | |
| Taccini Robert J | -- | -- | |
| Taccini Robert J | $1,625,000 | First American Title Guarant | |
| Pfeiffer Ranch Investors Inc | $1,170,000 | All Cal Title Company |
Source: Public Records
Mortgage History
| Date | Status | Borrower | Loan Amount |
|---|---|---|---|
| Open | Taccini Robert J | $1,000,000 | |
| Previous Owner | Pfeiffer Ranch Investors Inc | $2,800,000 | |
| Closed | Taccini Robert J | $100,000 |
Source: Public Records
Tax History Compared to Growth
Tax History
| Year | Tax Paid | Tax Assessment Tax Assessment Total Assessment is a certain percentage of the fair market value that is determined by local assessors to be the total taxable value of land and additions on the property. | Land | Improvement |
|---|---|---|---|---|
| 2025 | $29,606 | $2,497,584 | $1,536,979 | $960,605 |
| 2024 | $29,606 | $2,448,613 | $1,506,843 | $941,770 |
| 2023 | $29,115 | $2,400,602 | $1,477,298 | $923,304 |
| 2022 | $28,865 | $2,353,532 | $1,448,332 | $905,200 |
| 2021 | $28,374 | $2,307,385 | $1,419,934 | $887,451 |
| 2020 | $27,817 | $2,283,727 | $1,405,375 | $878,352 |
| 2019 | $27,269 | $2,238,949 | $1,377,819 | $861,130 |
| 2018 | $27,039 | $2,195,049 | $1,350,803 | $844,246 |
| 2017 | $26,849 | $2,152,010 | $1,324,317 | $827,693 |
| 2016 | $26,562 | $2,109,814 | $1,298,350 | $811,464 |
| 2015 | $26,418 | $2,078,124 | $1,278,848 | $799,276 |
| 2014 | $24,575 | $1,933,100 | $1,189,600 | $743,500 |
Source: Public Records
Map
Nearby Homes
- 6605 Bret Harte Dr
- 6565 Stonehill Dr
- 6698 Charter Oak Place
- 18950 Graystone Ln
- 6805 Almaden Rd
- 6871 Tunbridge Way
- 6898 Shearwater Dr
- 6628 Wildwood Ct
- 6579 Cooperage Ct
- 6803 Lenwood Way
- 775 Sunset Glen Dr
- 731 Los Huecos Dr
- 6298 Snell Ave
- 6421 Montana Ct
- 1122 Hearth Ct
- 5834 Santa Teresa Blvd
- 7025 Bret Harte Dr
- 783 Vereda Ct
- 6384 Farm Hill Way
- 625 Kiowa Cir
- 899 Vista Del Roble Place
- 892 Vista Del Roble Place
- 887 Vista Del Roble Place
- 916 Vista Del Roble Place
- 886 Vista Del Roble Place
- 893 Vista Del Roble Place
- 18430 Graystone Ln
- 6686 Graystone Ln
- 988 Vista Del Roble Place
- 18550 Annie Ln
- 18560 Annie Ln
- 18540 Annie Ln
- 18570 Annie Ln
- 18530 Annie Ln
- 6692 Graystone Ln
- 18750 Annie Ln
- 6674 Graystone Ln
- 6680 Graystone Ln
- 18611 Graystone Ln
- 18401 Graystone Ln